
4 VERSPM Tutorial
4.1 Overview
VERSPM is a strategic planning model that assists state and metropolitan area planners with the evaluation of transportation and land use policy scenarios. It considers a large number of factors which affect the performance of transportation systems and their effects on people and the environment. The Regional Strategic Planning Model (RSPM), was developed by the Oregon Department of Transportation (ODOT) for the purpose of estimating and forecasting the effects of various policies and other influences on the amount of vehicle travel, the types of vehicles and fuels used, and the resulting greenhouse gas (GHG) emissions among other outcomes.
The VERSPM model was initially developed to address the following factors:
- Changes in population demographics (age structure);
- Changes in personal income;
- Relative amounts of development occurring in metropolitan, urban and rural areas;
- Metropolitan, other urban, and rural area densities;
- Urban form in metropolitan areas (proportion of population living in mixed use areas with a well interconnected street and walkway system);
- Amounts of metropolitan area transit service;
- Metropolitan freeway and arterial supplies;
- Auto and light truck proportions by year;
- Average vehicle fuel economy by vehicle type and year;
- Vehicle age distribution by vehicle type;
- Electric vehicles (EVs), plug-in hybrid electric vehicles (PHEVs)
- Light-weight vehicles such as bicycles, electric bicycles, electric scooters, etc.;
- Pricing – fuel, vehicle miles traveled (VMT), parking;
- Demand management – employer-based and individual marketing;
- Car-sharing;
- Effects of congestion on fuel economy;
- Effects of incident management on fuel economy;
- Vehicle operation and maintenance – eco-driving, low rolling resistance tires, speed limits;
- Carbon intensity of fuels, including the well to wheels emissions; and
- Carbon production from the electric power that is generated to run electric vehicles.
4.1.1 Structure
VERSPM is a disaggregate policy model that predicts travel demand impacts at an individual household level. The model estimates vehicle ownership, vehicle travel, fuel consumption, and GHG emissions at the individual household level. This structure accounts for the synergistic and antagonistic effects of multiple policies and factors (e.g. gas prices) on vehicle travel and emissions. For example, the battery range of electric vehicles (EVs) and plug‐in hybrid electric vehicles (PHEVs) is less of an issue for households residing in compact mixed‐use neighborhoods because those households tend to drive fewer miles each day. Modeling at the household level makes it possible to evaluate the relationships between travel, emissions and the characteristics of households, land use, transportation systems, vehicles, and other factors. In addition, household level analysis makes it possible to evaluate the equitability of the costs and benefits of different strategies.
The model comprises sequential steps with feedback. Each calculation step is composed of a number of calculations that operate on the results of the previous calculation step and on input data that reflect inputs.
The VERSPM steps are grouped as follows:
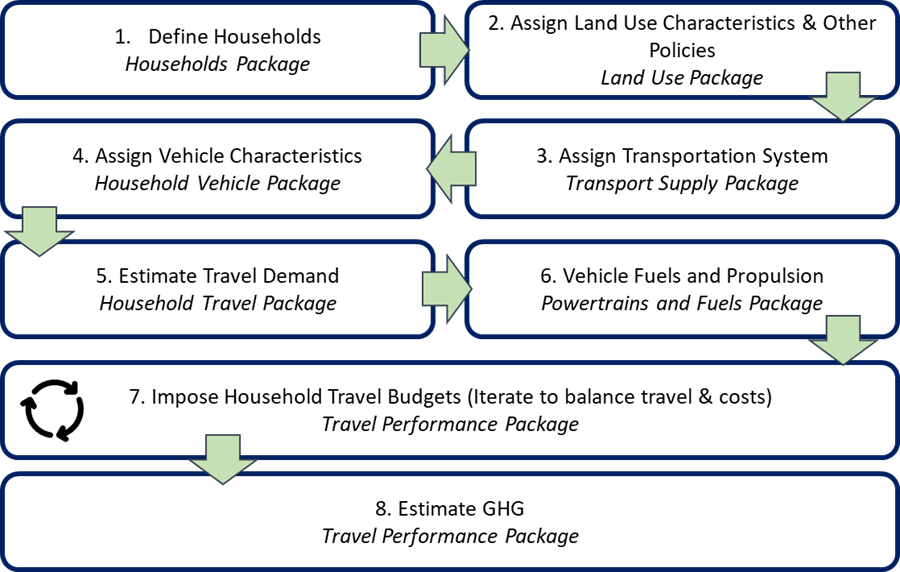
The iterative process to balance the VMT with travel costs allows congestion and other costs introduced at this step influence the amount of travel. This step balances the amount of household travel with the cost of travel and recalculates household VMT, Fuel & GHG in the process. The primary outputs of the RSPM are household travel, fuel and power consumption, and GHG emissions calculations, but other information is produced for households and commercial vehicles as well. The amount of commercial (light‐duty) and freight (heavy duty) travel is calculated as well as associated fuel, power consumption and GHG emissions for those vehicles.
4.1.2 Modules
- Household Modules - VESimHouseholds package
The following four modules create a set of households for each forecast year that represents each resident in the model area with the likely household mix of household and person characteristics:
- Land Use Modules - VELandUse package
The following five modules assigns a housing type to households (e.g. single-family, multi-family, etc.) and a development type (metropolitan, town, rural) based on available input dwelling units. Households are assigned a location in the metropolitan area based on the projected supply of housing and neighborhood affordability. Neighborhood population density and mixed-use character are calculated.
- Predict Housing
- Locate Employment
- Assign Location Types
- Calculate ‘4D’ Measures
- Calculate Urban Mix Measures
The following three modules identifies parking restrictions and prices affecting households, identifies households participating in TDM programs and assigns car service availability to zones (including car sharing and taxis):
- Transport Supply Modules - VETransportSupply package
The following two modules gather details about the relevant roadway and public transport systems considered in the simulation of travel:
- Household Vehicle Modules - VEHouseholdVehicles package
The following seven modules simulate details about the drivers of vehicles in the simulation and types of vehicles they drive:
- Assign Drivers
- Assign Vehicle Ownership
- Assign Vehicle Type
- Create Vehicle Table
- Assign Vehicle Age
- Calculate Vehicle Ownership Cost
- Adjust Vehicle Ownership
- Household Travel Modules - VEHouseholdTravel package
The following four module provides an initial estimate of average daily vehicle miles traveled (DVMT) for each household based on the household characteristics (e.g., demographics, income, transportation options, and land use). They also calculate the households non-motorized trips.
- Calculate Household Daily Vehicle Miles Traveled
- Calculate Non-Automobile or ‘Alternative’ Mode Trips
- Calculate Vehicle Trips
- Divert Single-occupant Vehicle Travel.
- Powertrain and Fuel Modules - VEPowertrainsAndFuels package
The following two modules identifies the vehicles powertrain as an internal combustion engine (ICE), hybrid-electric vehicle (HEV), plug-in hybrid electric vehicle (PHEV), or electric vehicle (EV) and calculates each household vehicle’s emission.
4.1.3 Feedback
THe next step balance the amount of household travel with the cost of travel and recalculate household VMT, Fuel and GHG emissions . This is necessary because: 1) congestion calculations affect fuel economy and thus the amount and cost of fuel consumed; 2) congestion pricing affects the amount of travel and household travel costs; 3) fuel, vehicle travel, and other taxes and fees affect the amount and cost of travel; and 4) eco-driving improves fuel economy and reduces fuel cost. The effect of these adjustments to household travel costs need to be included in the total household travel costs and the adjustment to household DVMT.
- Travel Performance - VETravelPerformance package
The following modules run iteratively to balance the DVMT and travel costs. Total light duty vehicle (household and commercial service vehicle), truck and bus DVMT is calculated for the metropolitan area and assigned to portions of the road system (freeway, arterial, other). Congestion levels are and associated speed reductions are calculated considering the traffic loads and inputs regarding the deployment of traffic operations programs (e.g. ramp metering, traffic signal coordination) and congestion pricing. Speed-adjusted fuel economy is calculated considering variations by powertrain. Travel cost per mile due to congestion pricing is also calculated. Household travel costs are calculated from the amounts of miles driven, fuel consumed, electricity consumed, and GHG emitted. Other inputs establish the rates for fuel costs, power costs, fuel taxes, VMT taxes, PAYD insurance, and several external costs. Finally a household budget model is used to adjust household DVMT to reflect the effect of household travel costs on the amount of household travel. The adjusted household DVMT is allocated to vehicles in proportion to the previous allocation. This process can run multiple times until DVMT changes very little between iterations.
- Calculate Road VMT
- Calculate Road Performance;
- Calculate Fuel and Electric Energy Economy
- Adjust Fuel and Electric Energy Economy
- Calculate Vehicle Operating Cost
- Adjust DVMT Based on Budget
- Heavy Vehicles Emissions - VETravelPerformance
The following two modules calculate heavy vehicle fuel and power consumption and GHG emissions:
4.2 Inputs and Parameters
The VERSPM model directory is organized with the following subdirectories:
Generally speaking, the VERPSM inputs are classified into the five following categories:
- User input model parameters: These are input parameters (model or scenario specific), or model definition files, that users should review and modify as needed.
- Fixed input model parameters: These are input parameters, or model definition files, specific to the model that users should not typically modify.
- User input files: These are input files (model or scenario specific) that users should review and modify as needed.
- Fixed input files: These are input files specific to the model that that users should not typically modify.
- Internal module inputs: These are inputs created by other VERSPM modules.
4.2.1 Model Definition Files
The following five files are located in the “defs” directory:
4.2.1.1 run_parameters.json
This file contains parameters that define key attributes of the model run and relationships to other model runs. This file is a needs to be modified by the user to specify the model base year and run years. A more detailed description of the file can be found here. The results of model run are stored in a directory with the name specified by "DatastoreName". This name should be changed when running different scenarios. For e.g. when running base scenario the output directory name can be set to BaseScenario by using "DatastoreName": "BaseScenario" in the file. The format of this file is as follows:
{
    "Model": "VERSPM",
    "Scenario": "Test",
    "Description": "Test of VERSPM",
    "Region": "RVMPO",
    "BaseYear": "2010",
    "Years": ["2010", "2038"],
    "DatastoreName": "Datastore",
    "DatastoreType": "RD",
    "Seed": 1
}
4.2.1.2 model_parameters.json
This file contains global parameters for a particular model configuration that may be used by multiple modules. A more detailed description of the file and its structure can be found here. The source of the default $16/hr is per a Nov 2016 ODOT Report: “The Value of Travel-Time: Estimates of the Hourly Value of Time for Vehicles in Oregon”.
The format of this file is as follows:
[
  {"NAME": "ValueOfTime",
   "VALUE": "16",
   "TYPE": "double",
   "UNITS": "base cost year dollars per hour"
  }
]
4.2.1.3 deflators.csv
This file defines the annual deflator values, such as the consumer price index, that are used to convert currency values between different years for currency denomination. This file does not need to be modified unless the years for which the dollar values used in the input dataset is not contained in this file. The format of the file is as follows:
| Year | Value |
|---|---|
| 1999 | 172.6 |
| 2000 | 178.0 |
| 2001 | 182.4 |
| … | … |
| 2010 | 218.344 |
| … | … |
| 2016 | 249.426 |
4.2.1.4 geo.csv
This file describes all of the geographic relationships for the model and the names of geographic entities in a CSV formatted text file. Azone, Bzone, and Marea should remain consistent with the input data. The format of the file is as follows:
| Azone | Bzone | Czone | Marea |
|---|---|---|---|
| RVMPO | D410290001001 | NA | RVMPO |
| RVMPO | D410290001002 | NA | RVMPO |
| RVMPO | D410290002011 | NA | RVMPO |
| RVMPO | D410290002012 | NA | RVMPO |
| RVMPO | D410290002013 | NA | RVMPO |
| RVMPO | D410290002021 | NA | RVMPO |
| RVMPO | D410290002022 | NA | RVMPO |
| RVMPO | D410290002023 | NA | RVMPO |
| RVMPO | D410290002031 | NA | RVMPO |
| RVMPO | D410290002032 | NA | RVMPO |
| RVMPO | D410290002033 | NA | RVMPO |
| RVMPO | D410290003001 | NA | RVMPO |
| RVMPO | … | NA | RVMPO |
To learn more about VERSPM model geographic relationships see here
4.2.1.5 units.csv
This file describes the default units to be used for storing complex data types in the model. This file should NOT be modified by the user. The format of the file is as follows:
| Type | Units |
|---|---|
| currency | USD |
| distance | MI |
| area | SQMI |
| mass | KG |
| volume | GAL |
| time | DAY |
| energy | GGE |
| people | PRSN |
| trips | VEH |
| area | TRIP |
| households | HH |
| employment | JOB |
| activity | HHJOB |
The VisionEval model system keeps track of the types and units of measure of all data that is processed. More details about the file and structure can be found here.
4.2.2 Input Files
- azone_carsvc_characteristics.csv: This file specifies the different characteristics for high and low car service level and is used in the CreateVehicleTable and AssignVehicleAge modules.
-
azone_charging_availability.csv This file has data on proportion of different household types who has EV charging available and is used in the AssignHHVehiclePowertrain module.
-
azone_electricity_carbon_intensity.csv (optional) This file is used to specify the carbon intensity of electricity and is only needed if user wants to modify the values). The file is used in Initialize (VEPowertrainsAndFuels) and CalculateCarbonIntensity modules.
-
azone_fuel_power_cost.csv This file supplies data for retail cost of fuel and electricity and is used in the CalculateVehicleOperatingCost module.
-
azone_gq_pop_by_age.csv: This file contains group quarters population estimates/forecasts by age and is used in the CreateHouseholds module.
- azone_hh_pop_by_age.csv This file contains population estimates/forecasts by age and is used in the CreateHouseholds module.
-
azone_hh_veh_mean_age.csv This file provides inputs for mean auto age and mean light truck age and is used in the AssignVehicleAge module.
-
azone_hh_veh_own_taxes.csv This file provides inputs for flat fees/taxes (i.e. annual cost per vehicle) and ad valorem taxes (i.e. percentage of vehicle value paid in taxes). The file is used in CalculateVehicleOwnCost module.
-
azone_hhsize_targets.csv: This file contains the household specific targets and is used in CreateHouseholds module.
- azone_lttrk_prop.csv This file specifies the light truck proportion of the vehicle fleet and is used in AssignVehicleType module.
-
azone_payd_insurance_prop.csv This file provides inputs on the proportion of households having PAYD (pay-as-you-drive) insurance and is used in the CalculateVehicleOwnCost module.
-
azone_per_cap_inc.csv This file contains information on regional average per capita household and group quarters income in year 2010 dollars and is used in the PredictIncome module.
-
azone_prop_sov_dvmt_diverted.csv This file provides inputs for a goal for diverting a portion of SOV travel within a 20-mile tour distance and is used in the DivertSovTravel module.
- azone_relative_employment.csv: This file contains ratio of workers to persons by age and is used in the PredictWorkers module.
-
azone_veh_use_taxes.csv This file supplies data for vehicle related taxes and is used in the CalculateVehicleOperatingCost module.
-
azone_vehicle_access_times.csv This file supplies data for vehicle access and egress time and is used in the CalculateVehicleOperatingCost module.
-
bzone_transit_service.csv This file supplies the data on relative public transit accessibility and is used in the AssignTransitService module.
- bzone_carsvc_availability.csv This file contains the information about level of car service availability and is used in the AssignCarSvcAvailability module.
-
bzone_dwelling_units.csv: This file contains the number single-family, multi-family and group-quarter dwelling units and is used in the PredictHousing module.
-
bzone_employment.csv: This file contains the total, retail and service employment by zone and is used in the LocateEmployment module. - bzone_hh_inc_qrtl_prop.csv This file contains the proportion of households in 1st, 2nd, 3rd, and 4th quartile of household income and is used in the PredictHousing module.
-
bzone_lat_lon.csv This file contains the latitude and longitude of the centroid of the zone and is used in the LocateEmployment module.
- bzone_network_design.csv This file contains the intersection density in terms of pedestrian-oriented intersections having four or more legs per square mile and is used in the Calculate4DMeasures module.
-
bzone_parking.csv This file contains the parking information and is used in the AssignParkingRestrictions module.
- bzone_travel_demand_mgt.csv This file contains the information about workers and households participating in demand management programs and is used in the AssignDemandManagement module.
- bzone_unprotected_area.csv This file contains the information about unprotected (i.e., developable) area within the zone and is used in the Calculate4DMeasures module.
- bzone_urban-mixed-use_prop.csv This file contains the target proportion of households located in mixed-used neighborhoods in zone and is used in the CalculateUrbanMixMeasure module.
-
bzone_urban-town_du_proportions.csv This file contains proportion of Single-Family, Multi-Family and Group Quarter dwelling units within the urban portion of the zone and is used in the AssignLocTypes module.
- marea_base_year_dvmt.csv (optional) This file is used to specify to adjust the DVMT growth factors and is only needed if user wants to modify the values. The file is used in the Initialize (VETravelPerformance), CalculateBaseRoadDvmt and CalculateFutureRoadDvmt modules.
-
marea_congestion_charges.csv (optional) This file is used to specify the charges of vehicle travel for different congestion levels. The file is used in the Initialize (VETravelPerformance) and CalculateRoadPerformance modules.
-
marea_dvmt_split_by_road_class.csv (optional) This file is used to specify the dvmt split for different road classes. The file is used in the Initialize (VETravelPerformance) and CalculateBaseRoadDvmt modules.
-
marea_lane_miles.csv This file contains inputs on the numbers of freeway lane-miles and arterial lane-miles and is used in the AssignRoadMiles module.
-
marea_operations_deployment.csv (optional) This file is used to specify the proportion of DVMT affected by operations for different road classes. The file is used in the Initialize (VETravelPerformance) and CalculateRoadPerformance modules.
-
marea_speed_smooth_ecodrive.csv This input file supplies information of deployment of speed smoothing and ecodriving by road class and vehicle type and is used in the CalculateMpgMpkwhAdjustments module.
- marea_transit_ave_fuel_carbon_intensity.csv (optional) This file is used to specify the average carbon intensity of fuel used by transit. The file is used in the Initialize (VETravelPerformance) module.
-
marea_transit_biofuel_mix.csv (optional) This file is used to specify the biofuel used by transit. The file is used in the Initialize (VETravelPerformance) and CalculateCarbonIntensity modules.
-
marea_transit_fuel.csv (optional) This file is used to specify the transit fuel proportions. The file is used in the Initialize (VETravelPerformance) and CalculateCarbonIntensity modules.
-
marea_transit_powertrain_prop.csv (optional) This file is used to specify the mixes of transit vehicle powertrains. The file is used in the Initialize (VETravelPerformance) and CalculatePtranEnergyAndEmissions modules.
-
marea_transit_service.csv This file contains annual revenue-miles for different transit modes for metropolitan area and is used in the AssignTransitService module.
- other_ops_effectiveness.csv (optional) This file is used to specify the delay effects of operations in different road classes and is only needed if user wants to modify the values. The file is used in the Initialize (VETravelPerformance) and CalculateRoadPerformance modules.
-
region_ave_fuel_carbon_intensity.csv (optional) This file is used to specify the average carbon density for different vehicle types and is optional (only needed if user wants to modify the values). The file is used in the Initialize (VETravelPerformance) and CalculateCarbonIntensity modules.
-
region_base_year_hvytrk_dvmt.csv (optional) This file is used to specify the heavy truck dvmt for base year. The file is used in the Initialize (VETravelPerformance), CalculateBaseRoadDvmt and CalculateFutureRoadDvmt modules.
-
region_carsvc_powertrain_prop.csv (optional) This file is used to specify the powertrain proportion of car services. The file is used in the Initialize (VETravelPerformance), AssignHhVehiclePowertrain and AdjustHhVehicleMpgMpkwh modules.
-
region_comsvc_lttrk_prop.csv This file supplies data for the light truck proportion of commercial vehicles and is used in the CalculateComEnergyAndEmissions module.
-
region_comsvc_powertrain_prop.csv (optional) This file is used to specify the powertrain proportion of commercial vehicles. The file is used in the Initialize (VEPowertrainsAndFuels) and CalculateComEnergyAndEmissions modules.
- region_hh_driver_adjust_prop.csv (optional) This file specifies the relative driver licensing rate relative to the model estimation data year and is used in the AssignDrivers module.
- region_hvytrk_powertrain_prop.csv (optional) This file is used to specify the powertrain proportion of heavy duty trucks. The file is used in the Initialize (VEPowertrainsAndFuels) and CalculateComEnergyAndEmissions modules.
- region_prop_externalities_paid.csv This file supplies data for climate change and other social costs and is used in the CalculateVehicleOperatingCost module.
4.3 Modules and Outputs
The VERSPM model is a compilation of several modules, listed below:
The following section describes each module, its required inputs, and its generated outputs.
4.3.1 CreateHouseholds
This module creates simulated households using inputs of population by age group by simulation year.
User Input Files
Household Population (azone_hh_pop_by_age.csv)
This file contains population estimates/forecasts by age for each of the base and future years. The file format includes number of persons within six age groups:
- 0-14
- 15-19
- 20-29
- 30-54
- 55-64
- 65 Plus
Base year data for population by age category can be sourced from the Census. Future year data must be developed by the user; in many regions population forecasts are available from regional or state agencies such as population data centers, universities, metropolitan planning organizations, or similar agencies.
Here is a snapshot of the file:
| Geo | Year | Age0to14 | Age15to19 | Age20to29 | Age30to54 | Age55to64 | Age65Plus |
|---|---|---|---|---|---|---|---|
| RVMPO | 2010 | 30193 | 10970 | 20557 | 52327 | 24840 | 29240 |
| RVMPO | 2038 | 39759 | 12781 | 24972 | 75984 | 27563 | 66139 |
Household Size (azone_hhsize_targets.csv)
This file contains the household-specific targets for the population synthesizer. This file contains two attributes:
- AveHhSize: Average household size for non-group quarters households
- Prop1PerHh: Proportion of non-group quarters households having only one person
Household size data for the base year can be sourced from the Census.
Here is a snapshot of the file:
| Geo | Year | AveHhSize | Prop1PerHh |
|---|---|---|---|
| RVMPO | 2010 | NA | 0.3 |
| RVMPO | 2038 | NA | NA |
Group Quarter Population (azone_gq_pop_by_age.csv)
This file contains group quarters population estimates/forecasts by age for each of the base and future years. The file format includes number of persons within the following six age categories:
- 0-14
- 15-19
- 20-29
- 30-54
- 55-64
- 65 Plus
Group quarters are distinguished between two types: institutional and non-institutional. Institutional group quarter populations are those in correctional facilities or nursing homes. Non-institutional group quarters include college dormitories, military barracks, group homes, missions, or shelters. Only non-institutional group quarters are included in the modeled population, given the assumption that institutional group quarters populations do not account for much, if any, travel. Base year data for group quarter populations can be sourced from the Census.
Here is a snapshot of the file:| Geo | Year | GrpAge0to14 | GrpAge15to19 | GrpAge20to29 | GrpAge30to54 | GrpAge55to64 | GrpAge65Plus |
|---|---|---|---|---|---|---|---|
| RVMPO | 2010 | 0 | 666 | 382 | 66 | 7 | 0 |
| RVMPO | 2038 | 0 | 666 | 382 | 66 | 7 | 0 |
Module Outputs
Households are created with the number of persons in each of six age categories (0-14, 15-19, 20-29, 30-54, 55-64, and 65+) and the total number of persons in the household. Two types of households are created: regular households (i.e. not persons living in group quarters) and group quarters households .
- HhId: Unique household ID
- HhSize: Number of persons
- Age0to14: Persons in 0 to 14 year old age group
- Age15to19: Persons in 15 to 19 year old age group
- Age20to29: Persons in 20 to 29 year old age group
- Age30to54: Persons in 30 to 54 year old age group
- Age55to64: Persons in 55 to 64 year old age group
- Age65Plus: Persons in 65 or older age group
-
HhType: Coded household age composition (e.g.,
2-1-0-2-0-0) orGrpfor group quarters
4.3.2 PredictWorkers
This module assigns workers by age to households and to non-institutional group quarters population. It is a simple model which predicts workers as a function of the household type and age composition.
User Input Files
Relative employment (azone_relative_employment.csv)
This file contains the ratio of workers to persons by age cohort in the model year relative to the model estimation data year. This file contains five age cohorts:
- RelEmp15to19: Ratio of workers to persons age 15 to 19 in model year versus in estimation data year
- RelEmp20to29: Ratio of workers to persons age 20 to 29 in model year versus in estimation data year
- RelEmp30to54: Ratio of workers to persons age 30 to 54 in model year versus in estimation data year
- RelEmp55to64: Ratio of workers to persons age 55 to 64 in model year versus in estimation data year
- RelEmp65Plus: Ratio of workers to persons age 65 or older in model year versus in estimation data year
Setting a value of 1 assumes that the ratio of workers to persons is consistent with estimation data for that specific age cohort.
Here is a snapshot of the file:| Geo | Year | RelEmp15to19 | RelEmp20to29 | RelEmp30to54 | RelEmp55to64 | RelEmp65Plus |
|---|---|---|---|---|---|---|
| RVMPO | 2010 | 1 | 1 | 1 | 1 | 1 |
| RVMPO | 2038 | 1 | 1 | 1 | 1 | 1 |
Internal Module Inputs
| Package | Module | Outputs | Description |
|---|---|---|---|
| VESimHouseholds | CreateHouseholds | Age0to14 | Persons in 0 to 14 year old age group |
| VESimHouseholds | CreateHouseholds | Age15to19 | Persons in 15 to 19 year old age group |
| VESimHouseholds | CreateHouseholds | Age20to29 | Persons in 20 to 29 year old age group |
| VESimHouseholds | CreateHouseholds | Age30to54 | Persons in 30 to 54 year old age group |
| VESimHouseholds | CreateHouseholds | Age55to64 | Persons in 55 to 64 year old age group |
| VESimHouseholds | CreateHouseholds | Age65Plus | Persons in 65 or older age group |
| VESimHouseholds | CreateHouseholds | HHType | Coded household age composition |
Module Outputs
- Wkr15to19: Workers in 15 to 19 year old age group
- Wkr20to29: Workers in 20 to 29 year old age group
- Wkr30to54: Workers in 30 to 54 year old age group
- Wkr55to64: Workers in 55 to 64 year old age group
- Wkr65Plus: Workers in 65 or older age group
- Workers: Total workers
- NumWkr: Number of workers residing in the zone
For more information see here
4.3.3 AssignLifeCycle
This module assigns a life cycle category to each household. The life cycle categories are similar, but not the same as, those established for the National Household Travel Survey (NHTS). The age categories used in VisionEval models are broader than those used by the NHTS to identify children of different ages. This is a simple model with set of rules that assigns age group categories based on the age of persons and workers in the household.
Internal Module Inputs
| Package | Module | Outputs | Description |
|---|---|---|---|
| VESimHouseholds | CreateHouseholds | Age0to14 | Persons in 0 to 14 year old age group |
| VESimHouseholds | CreateHouseholds | Age15to19 | Persons in 15 to 19 year old age group |
| VESimHouseholds | CreateHouseholds | Age20to29 | Persons in 20 to 29 year old age group |
| VESimHouseholds | CreateHouseholds | Age30to54 | Persons in 30 to 54 year old age group |
| VESimHouseholds | CreateHouseholds | Age55to64 | Persons in 55 to 64 year old age group |
| VESimHouseholds | CreateHouseholds | Age65Plus | Persons in 65 or older age group |
| VESimHouseholds | CreateHouseholds | HHType | Coded household age composition |
| VESimHouseholds | PredictWorkers | Wrk15to19 | Workers in 15 to 19 year old age group |
| VESimHouseholds | PredictWorkers | Wrk20to29 | Workers in 20 to 29 year old age group |
| VESimHouseholds | PredictWorkers | Wrk30to54 | Workers in 30 to 54 year old age group |
| VESimHouseholds | PredictWorkers | Wrk55to64 | Workers in 55 to 64 year old age group |
| VESimHouseholds | PredictWorkers | Wrk65Plus | Workers in 65 or older age group |
Module Outputs
-
LifeCycle: Household life cycle as defined by 2009 NHTS
LIF_CYCvariable
For more information see here
4.3.4 PredictIncome
This module predicts the income for each simulated household given the number of workers in each age group and the average per capita income for the Azone where the household resides.
User Input Files
Regional Income (azone_per_cap_inc.csv)
This file contains information on regional average per capita household (HHIncomePC) and group quarters (GQIncomePC) income by forecast year in year 2010 dollars. The data can be obtained from the U.S. Department of Commerce Bureau of Economic Analysis for the current year or from regional or state sources for forecast years. In order to use current year dollars just replace 2010 in column labels with current year. For example, if the data is obtained in year 2015 dollars then the column labels in the file shown below will become HHIncomePC.2015 and GQIncomePC.2015.
| Geo | Year | HHIncomePC.2010 | GQIncomePC.2010 |
|---|---|---|---|
| RVMPO | 2010 | 32164 | 7500 |
| RVMPO | 2038 | 43334 | 10000 |
Internal Module Inputs
| Package | Module | Outputs | Description |
|---|---|---|---|
| VESimHouseholds | CreateHouseholds | HHSize | Number of persons in the household |
| VESimHouseholds | CreateHouseholds | Age65Plus | Persons in 65 or older age group |
| VESimHouseholds | CreateHouseholds | HHType | Coded household age composition |
| VESimHouseholds | PredictWorkers | Wrk15to19 | Workers in 15 to 19 year old age group |
| VESimHouseholds | PredictWorkers | Wrk20to29 | Workers in 20 to 29 year old age group |
| VESimHouseholds | PredictWorkers | Wrk30to54 | Workers in 30 to 54 year old age group |
| VESimHouseholds | PredictWorkers | Wrk55to64 | Workers in 55 to 64 year old age group |
Module Outputs
- Income: Total annual household (non-qroup and group quarters) income
For more information see here
4.3.5 PredictHousing
This module assigns a housing type, either single-family (SF) or multifamily (MF) to non-group quarters households based on the respective supplies of SF and MF dwelling units in the housing market to which the household is assigned (i.e. the Azone the household is assigned to) and household characteristics. The model then assigns each household to a Bzone based on the household’s housing type and income quartile as well as the supply of housing by type and Bzone (an input), and the distribution of households by income quartile for each Bzone (an input). The module assigns non-institutional group quarters households to Bzones based on the supply of group quarters units by Bzone.
User Input Files
Dwelling Units (bzone_dwelling_units.csv)
This file contains the number single-family dwelling units (SFDU), multifamily dwelling units (MFDU) and group-quarter dwelling units (GQDU) by Bzone for each of the base and future years. Data for the base year for single-family and multifamily dwelling units can be sourced from Census housing data with information on units in structure, with multifamily dwelling units defined as any structures with 2-or-more units. For group quarters, unless more detailed local data is available, Census data for non-institutionalized group quarter population can serve as a proxy for dwelling units assuming a 1:1 ratio of dwelling unit per GQ population.
| Geo | Year | SFDU | MFDU | GQDU |
|---|---|---|---|---|
| D410290014002 | 2010 | 559 | 0 | 0 |
| D410290013012 | 2010 | 79 | 8 | 523 |
| D410290014001 | 2010 | 1398 | 180 | 0 |
| D410290014003 | 2010 | 1385 | 172 | 0 |
| D410290013021 | 2010 | 271 | 0 | 0 |
Household Proportion by Income (bzone_hh_inc_qrtl_prop.csv)
This file contains the proportion of Bzone non-group quarters households by quartile of Azone household income category for each of the base and future years. The total for each Bzone should sum to 1.
| Geo | Year | HhPropIncQ1 | HhPropIncQ2 | HhPropIncQ3 | HhPropIncQ4 |
|---|---|---|---|---|---|
| D410290014002 | 2010 | 0.12 | 0.54 | 0.26 | 0.54 |
| D410290013012 | 2010 | 0.00 | 0.32 | 0.36 | 0.32 |
| D410290014001 | 2010 | 0.24 | 0.16 | 0.26 | 0.16 |
| D410290014003 | 2010 | 0.16 | 0.19 | 0.36 | 0.19 |
| D410290013021 | 2010 | 0.29 | 0.29 | 0.15 | 0.29 |
Internal Module Inputs
| Package | Module | Outputs | Description |
|---|---|---|---|
| VESimHouseholds | CreateHouseholds | HHSize | Number of persons in the household |
| VESimHouseholds | CreateHouseholds | HHType | Coded household age composition |
| VESimHouseholds | CreateHouseholds | Age15to19 | Persons in 15 to 19 year old age group |
| VESimHouseholds | CreateHouseholds | Age20to29 | Persons in 20 to 29 year old age group |
| VESimHouseholds | CreateHouseholds | Age30to54 | Persons in 30 to 54 year old age group |
| VESimHouseholds | CreateHouseholds | Age55to64 | Persons in 55 to 64 year old age group |
| VESimHouseholds | CreateHouseholds | Age65Plus | Persons in 65 or older age group |
| VESimHouseholds | PredictWorkers | Workers | Total workers in the household |
| VESimHouseholds | PredictIncome | Income | Total annual income of household |
Module Outputs
- HouseType: Type of dwelling unit of the household
- SF: Number of households living in single family dwelling units in zone
- MF: Number of households living in multi-family dwelling units in zone
- GQ: Number of persons living in group quarters in zone
- Pop: Population residing in zone
- NumHh: Number of households in zone
- NumWkr: Number of workers in zone
For more information see here
4.3.6 LocateEmployment
This module places employment in Bzones based on input assumptions of employment by type and Bzone. The model adjusts the employment numbers to balance with the number of workers in the region. The module creates a worker table and assigns workers to Bzone employment locations as a function of the number of jobs in each Bzone and the distance between residence and employment Bzones.
User Input Files
Employment Data (bzone_employment.csv)
This file contains the total, retail and service employment by zone for each of the base and future years. Employment categorizations are from the Environmental Protection Agency’s (EPA) Smart Location Database 5-tier employment classification.
- TotEmp: Total number of jobs in zone
- RetEmp: Number of jobs in retail sector in zone (Census LEHD: CNS07)
- SvcEmp: Number of jobs in service sector in zone (Census LEHD: CNS12 + CNS14 + CNS15 + CNS16 + CNS19)
| Geo | Year | TotEmp | RetEmp | SvcEmp |
|---|---|---|---|---|
| D410290014002 | 2010 | 403 | 262 | 96 |
| D410290013012 | 2010 | 1382 | 73 | 880 |
| D410290014001 | 2010 | 271 | 12 | 172 |
| D410290014003 | 2010 | 609 | 66 | 413 |
| D410290013021 | 2010 | 49 | 1 | 41 |
Zonal Latituted Longitude (bzone_lat_lon.csv)
This file contains the latitude and longitude of the centroid of the zone.
Here is a snapshot of the file:| Geo | Year | Latitude | Longitude |
|---|---|---|---|
| D410290014002 | 2010 | 42.48657 | -122.8014 |
| D410290013012 | 2010 | 42.44259 | -122.8461 |
| D410290014001 | 2010 | 42.46010 | -122.7925 |
| D410290014003 | 2010 | 42.47673 | -122.8008 |
| D410290013021 | 2010 | 42.37304 | -122.7793 |
Internal Module Inputs
| Package | Module | Outputs | Description |
|---|---|---|---|
| VESimHouseholds | CreateHouseholds | HhId | Household id |
| VESimHouseholds | PredictWorkers | Workers | Total workers in the household |
| VESimHouseholds | PredictWorkers | NumWkr | Number of workers residing in the zone |
Module Outputs
- TotEmp: Total number of jobs in zone
- RetEmp: Number of jobs in retail sector in zone
- SvcEmp: Number of jobs in service sector in zone
- WkrId: Unique worker ID
-
DistanceToWork: Distance from home to work assuming location at
Bzonecentroid and ‘Manhattan’ distance
For more information see here
4.3.7 AssignLocTypes
This module assigns households to location types: Urban (located within an urbanized area boundary), Town (located in a smaller urban area that does not have enough population to qualify as an urbanized area), and Rural (located in an area characterized by low density dispersed development).
User Input Files
Urban dwelling proportion (bzone_urban-town_du_proportions.csv)
This file contains proportion of SF, MF and GQ dwelling units within the urban portion of the zone.
- PropUrbanSFDU: Proportion of single family dwelling units located within the urban portion of the zone
- PropUrbanMFDU: Proportion of multi-family dwelling units located within the urban portion of the zone
- PropUrbanGQDU: Proportion of group quarters accommodations located within the urban portion of the zone
- PropTownSFDU: Proportion of single family dwelling units located within the town portion of the zone
- PropTownMFDU: Proportion of multi-family dwelling units located within the town portion of the zone
- PropTownGQDU: Proportion of group quarters accommodations located within the town portion of the zone
| Geo | Year | PropUrbanSFDU | PropUrbanMFDU | PropUrbanGQDU | PropTownSFDU | PropTownMFDU | PropTownGQDU |
|---|---|---|---|---|---|---|---|
| D410290014002 | 2010 | 0.4686941 | 1 | 1 | 0 | 0 | 0 |
| D410290013012 | 2010 | 0.8860759 | 1 | 1 | 0 | 0 | 0 |
| D410290014001 | 2010 | 0.8626609 | 1 | 1 | 0 | 0 | 0 |
| D410290014003 | 2010 | 0.9906137 | 1 | 1 | 0 | 0 | 0 |
| D410290013021 | 2010 | 0.0147601 | 1 | 1 | 0 | 0 | 0 |
Internal Module Inputs
| Package | Module | Outputs | Description |
|---|---|---|---|
| VESimHouseholds | CreateHouseholds | HhId | Household id |
| VESimHouseholds | PredictWorkers | HhSize | Number of persons in household |
| VESimHouseholds | PredictIncome | Income | Total annual income of household |
| VELandUse | PredictHousing | HouseType | Type of dwelling unit of the household |
Module Outputs
- LocType: Location type (Urban, Town, Rural) of the place where the household resides
- UrbanPop: Urbanized area population
- RuralPop: Rural (i.e. non-urbanized area) population
- TownPop: Town (i.e. urban but non-urbanized area) population
- UrbanIncome: Total household income of the urbanized area population
- TownIncome: Total household income of the town (i.e. urban but non-urbanized area) population
- RuralIncome: Total household income of the rural (i.e. non-urbanized area) population
For more information see here
4.3.8 Calculate4DMeasures
This module calculates several so-called ‘4D’ measures by Bzone including density, diversity (i.e. mixing of land uses), transportation network design, and destination accessibility, i.e., the four ‘Ds’ of density, diversity, design, and destination accessibility. These measures are the same as or are similar to measures included in the EPA’s Smart Location Database
User Input Files
Developable Area (bzone_unprotected_area.csv)
This file contains the information about unprotected (i.e., developable) area within the zone.
-
UrbanArea: Area that is
Urbanand unprotected (i.e. developable) within the zone (Acres) -
TownArea: Area that is
Townand unprotected within the zone (Acres) -
RuralArea: Area that is
Ruraland unprotected within the zone (Acres)
| Geo | Year | UrbanArea | TownArea | RuralArea |
|---|---|---|---|---|
| D410290014002 | 2010 | 298.6487137 | 0 | 4996.11876 |
| D410290013012 | 2010 | 830.6009450 | 0 | 384.80922 |
| D410290014001 | 2010 | 983.1506646 | 0 | 3699.94017 |
| D410290014003 | 2010 | 439.2145619 | 0 | 90.86259 |
| D410290013021 | 2010 | 0.3548548 | 0 | 6212.57640 |
Network density (bzone_network_design.csv)
This file contains values for D3bpo4, a measure for intersection density determined by the number of pedestrian-oriented intersections having four or more legs per square mile. The data to inform this input can be sourced from the EPA’s Smart Location Database.
| Geo | Year | D3bpo4 |
|---|---|---|
| D410290014002 | 2010 | 0.2618757 |
| D410290013012 | 2010 | 0.4830901 |
| D410290014001 | 2010 | 1.8038130 |
| D410290014003 | 2010 | 18.9766301 |
| D410290013021 | 2010 | 0.1013039 |
Internal Module Inputs
| Package | Module | Outputs | Description |
|---|---|---|---|
| VELandUse | PredictHousing | Pop | Population residing in zone |
| VELandUse | PredictHousing | NumHh | Number of households in zone |
| VELandUse | PredictHousing | NumWkr | Number of workers in zone |
| VELandUse | LocateEmployment | TotEmp | Total number of jobs in zone |
| VELandUse | LocateEmployment | RetEmp | Number of jobs in retail sector in zone |
| VELandUse | LocateEmployment | SvcEmp | Number of jobs in service sector in zone |
Module Outputs
- D1B: Gross population density (people/acre) on unprotected (i.e. developable) land in zone
- D1C: Gross employment density (jobs/acre) on unprotected land land in zone
- D1D: Gross activity density (employment + households) on unprotected land in zone
- D2A_JPHH: Ratio of jobs to households in zone
- D2A_WRKEMP: Ratio of workers to jobs in zone
- D2A_EPHHM: Employment and household entropy measure for zone considering numbers of households, retail jobs, service jobs, and other jobs
- D5: Destination accessibility of zone calculated as harmonic mean of jobs within two (2) miles and population within five (5) miles
For more information see here
4.3.9 CalculateUrbanMixMeasure
This module calculates an urban mixed-use measure based on the 2001 National Household Travel Survey (NHTS) measure of the tract level urban/rural indicator. This measure, developed by Claritas, uses the density of the tract and surrounding tracts to identify the urban/rural context of the tract. The categories include urban, suburban, second city, town and rural. Mapping of example metropolitan areas shows that places identified as urban correspond to central city and inner neighborhoods characterized by mixed use, higher levels of urban accessibility, and higher levels of walk/bike/transit accessibility.
User Input Files
Household Neighborhood (bzone_urban-mixed-use_prop.csv)
This file contains the target proportion of households located in mixed-used neighborhoods in each zone.
-
MixUseProp: Target for proportion of households located in mixed-use neighborhoods in zone (or
NAif no target)
| Geo | Year | MixUseProp |
|---|---|---|
| D410290014002 | 2010 | 0.1 |
| D410290013012 | 2010 | NA |
| D410290014001 | 2010 | NA |
| D410290014003 | 2010 | NA |
| D410290013021 | 2010 | NA |
Internal Module Inputs
| Package | Module | Outputs | Description |
|---|---|---|---|
| VESimHouseholds | CreateHouseholds | HhId | Household id |
| VELandUse | PredictHousing | HouseType | Type of dwelling unit of the household |
| VELandUse | PredictHousing | NumHh | Number of households in zone |
| VELandUse | AssignLocTypes | UrbanPop | Urbanized area population |
| VELandUse | AssignLocTypes | RuralPop | Rural (i.e. non-urbanized area) population |
Module Outputs
-
IsUrbanMixNbrhd: Flag identifying whether household is (
1) or is not (0) in an urban, mixed-use neighborhood
For more information see here
4.3.10 AssignParkingRestrictions
This module identifies parking restrictions and prices affecting households at their residences, workplaces, and other places they are likely to visit in the urban area. The parking restriction/cost information is used by other modules in calculating the cost of vehicle ownership and the cost of vehicle use.
User Input Files
Parking Availability (bzone_parking.csv)
This file contains the parking information by Bzone for each of the base and future years. Users should use available local data on parking availability, costs, and program participation to develop this input.
- PkgSpacesPerSFDU: Average number of free parking spaces available to residents of single-family dwelling units
- PkgSpacesPerMFDU: Average number of free parking spaces available to residents of multifamily dwelling units
- PkgSpacesPerGQ: Average number of free parking spaces available to group quarters residents
- PropWkrPay: Proportion of workers who pay for parking
- PropCashOut: Proportions of workers paying for parking in a cash-out-buy-back program
- PkgCost: Average daily cost for long-term parking (e.g. paid on monthly basis)
| Geo | Year | PkgSpacesPerSFDU | PkgSpacesPerMFDU | PkgSpacesPerGQ | PropWkrPay | PropCashOut | PkgCost.2010 |
|---|---|---|---|---|---|---|---|
| D410290014002 | 2010 | 3 | 1.5 | 0 | 0 | 0 | 0 |
| D410290013012 | 2010 | 4 | 4.0 | 0 | 0 | 0 | 0 |
| D410290014001 | 2010 | 4 | 4.0 | 0 | 0 | 0 | 0 |
| D410290014003 | 2010 | 4 | 4.0 | 0 | 0 | 0 | 0 |
| D410290013021 | 2010 | 4 | 4.0 | 0 | 0 | 0 | 0 |
Internal Module Inputs
| Package | Module | Outputs | Description |
|---|---|---|---|
| VELandUse | PredictHousing | NumHh | Number of households in zone |
| VELandUse | PredictHousing | HouseType | Type of dwelling unit of the household |
| VELandUse | LocateEmployment | RetEmp | Number of jobs in retail sector in zone |
| VELandUse | LocateEmployment | SvcEmp | Number of jobs in service sector in zone |
Module Outputs
- FreeParkingSpaces: Number of free parking spaces available to the household
- ParkingUnitCost: Daily cost for long-term parking (e.g., parking paid for on a monthly basis)
- OtherParkingCost: Daily cost for parking at shopping locations or other locations of paid parking not including work
-
PaysForParking: Does worker pay for parking:
1= yes,0= no -
IsCashOut: Is worker part of a cash-out-buy-back program:
1= yes,0= no - ParkingCost: Daily cost for long-term parking (e.g., parking paid for on a monthly basis)
For more information see here
4.3.11 AssignDemandManagement
This module assigns demand management program participation to households and to workers. Households are assigned to individualized marketing program participation. Workers are assigned to employee commute options participation. The module computes the net proportional reduction in household daily VMT (DVMT) based on the participation in travel demand management programs.
User Input Files
Demand Management (bzone_travel_demand_mgt.csv)
This file contains the information about workers and households participating in demand management programs. Users should use available local data on travel demand management programs to develop this input.
* EcoProp: Proportion of workers working in Bzone who participate in strong employee commute options program (can also be used to approximate the impacts of teleworking)
* ImpProp: Proportion of households residing in Bzone who participate in strong individualized marketing program
| Geo | Year | EcoProp | ImpProp |
|---|---|---|---|
| D410290014002 | 2010 | 0.0 | 0.0 |
| D410290013012 | 2010 | 0.2 | 0.4 |
| D410290014001 | 2010 | 0.2 | 0.4 |
| D410290014003 | 2010 | 0.0 | 0.0 |
| D410290013021 | 2010 | 0.0 | 0.0 |
Internal Module Inputs
| Package | Module | Outputs | Description |
|---|---|---|---|
| VESimHouseholds | CreateHouseholds | HhId | Household id |
| VESimHouseholds | CreateHouseholds | HHSize | Number of persons in the household |
| VESimHouseholds | PredictWorkers | Workers | Total workers in the household |
Module Outputs
-
IsIMP: Identifies whether household is participant in travel demand management individualized marketing program (IMP):
1= yes,0= no - PropTdmDvmtReduction: Proportional reduction in household DVMT due to participation in travel demand management programs
-
IsECO: Identifies whether worker is a participant in travel demand management employee commute options program:
1= yes,0= no
For more information see here
4.3.12 AssignCarSvcAvailability
This module reads in and assigns ‘car service’ availability in Bzones. Car services include taxis, car sharing services (e.g. Car-To-Go, Zipcar), and future automated taxi services. A high level of car service is increases household car availability – similar to owning a car. Low levels of car service does not have competitive access time and therefore does not increase household car availability.
User Input Files
Car Service Availability (bzone_carsvc_availability.csv)
This file contains the information about level of car service availability and contains a value of either Low or High for Bzones. High means car service access is competitive with household owned car and will impact household vehicle ownership; Low is not competitive and will not impact household vehicle ownership.
| Geo | Year | CarSvcLevel |
|---|---|---|
| D410290014002 | 2010 | Low |
| D410290013012 | 2010 | Low |
| D410290014001 | 2010 | Low |
| D410290014003 | 2010 | Low |
| D410290013021 | 2010 | Low |
Module Outputs
-
CarSvcLevel: Level of car service availability for household.
Highmeans access is competitive with household owned car;Lowis not competitive.
For more information see here
4.3.13 AssignTransitService
This module assigns transit service level to the metropolitan area (Marea) and neighborhoods (Bzones). Annual revenue-miles (i.e. transit miles in revenue service) by transit mode type are read from an input file. The following eight modes are recognized:
-
DR= Demand-responsive -
VP= Vanpool and similar -
MB= Standard motor bus -
RB= Bus rapid transit and commuter bus -
MG= Monorail/automated guideway -
SR= Streetcar/trolley bus/inclined plain -
HR= Heavy Rail/Light Rail -
CR= Commuter Rail/Hybrid Rail/Cable Car/Aerial Tramway
Revenue miles are converted to bus (i.e., MB) equivalents using factors derived from urbanized area data from the National Transit Database (NTD). Bus-equivalent revenue miles are used in models which predict vehicle ownership and household DVMT.
Revenue miles by mode type are also translated (using NTD data) into vehicle miles by three vehicle types: van, bus, and rail. Miles by vehicle type are used to calculate public transit energy consumption and emissions.
User Input Files
Transit Service for Marea (marea_transit_service.csv)
This file contains annual revenue-miles for different transit modes for metropolitan area. Data to develop this input can be sourced from the Federal Transit Administration NTD.
- DRRevMi: Annual revenue-miles of demand-responsive public transit service
- VPRevMi: Annual revenue-miles of van-pool and similar public transit service
- MBRevMi: Annual revenue-miles of standard bus public transit service
- RBRevMi: Annual revenue-miles of rapid-bus and commuter bus public transit service
- MGRevMi: Annual revenue-miles of monorail and automated guideway public transit service
- SRRevMi: Annual revenue-miles of streetcar and trolleybus public transit service
- HRRevMi: Annual revenue-miles of light rail and heavy rail public transit service
- CRRevMi: Annual revenue-miles of commuter rail, hybrid rail, cable car, and aerial tramway public transit service
| Geo | Year | DRRevMi | VPRevMi | MBRevMi | RBRevMi | MGRevMi | SRRevMi | HRRevMi | CRRevMi |
|---|---|---|---|---|---|---|---|---|---|
| RVMPO | 2010 | 382639 | 0 | 607922 | 0 | 0 | 0 | 0 | 0 |
| RVMPO | 2038 | 2381995 | 0 | 3580237 | 0 | 0 | 0 | 0 | 0 |
Transit service for Bzone (bzone_transit_service.csv)
This file supplies the data on relative public transit accessibility at the Bzone level. The data to inform this input can be sourced from the EPA’s Smart Location Database.
- D4c: Aggregate frequency of transit service within 0.25 miles of block group boundary per hour during evening peak period (Ref: EPA 2010 Smart Location Database)
| Geo | Year | D4c |
|---|---|---|
| D410290014002 | 2010 | 0 |
| D410290013012 | 2010 | 0 |
| D410290014001 | 2010 | 0 |
| D410290014003 | 2010 | 0 |
| D410290013021 | 2010 | 0 |
Internal Module Inputs
| Package | Module | Outputs | Description |
|---|---|---|---|
| VELandUse | AssignLocTypes | UrbanPop | Urbanized area population |
Module Outputs
- TranRevMiPC: Ratio of annual bus-equivalent revenue-miles (i.e., revenue-miles at the same productivity - passenger miles per revenue mile - as standard bus) to urbanized area population
- VanDvmt: Total daily miles traveled by vans of various sizes to provide demand responsive, vanpool, and similar services.
- BusDvmt: Total daily miles traveled by buses of various sizes to provide bus service of various types.
- RailDvmt: Total daily miles traveled by light rail, heavy rail, commuter rail, and similar types of vehicles.
For more information see here
4.3.14 AssignRoadMiles
This module assigns freeway and arterial lane-miles to metropolitan areas (Marea) and calculates freeway lane-miles per capita.
User Input Files
Lane-Miles (marea_lane_miles.csv)
This file contains inputs on the numbers of freeway lane-miles and arterial lane-miles by Marea and year. The data to develop this input can be sourced from the FHWA Highway Performance Monitoring System (HPMS), using either the HPMS geospatial data or Highway Statistics, or the State DOT.
- FwyLaneMi: Lane-miles of roadways functionally classified as freeways or expressways in the urbanized portion of the metropolitan area
- ArtLaneMi: Lane-miles of roadways functionally classified as arterials (but not freeways or expressways) in the urbanized portion of the metropolitan area
| Geo | Year | FwyLaneMi | ArtLaneMi |
|---|---|---|---|
| RVMPO | 2010 | 91 | 356 |
| RVMPO | 2038 | 97 | 371 |
Internal Module Inputs
| Package | Module | Outputs | Description |
|---|---|---|---|
| VELandUse | AssignLocTypes | UrbanPop | Urbanized area population |
Module Outputs
- FwyLaneMiPC: Ratio of urbanized area freeway and expressway lane-miles to urbanized area population
For more information see here
4.3.15 AssignDrivers
This module assigns drivers by age group to each household as a function of the numbers of persons and workers by age group, the household income, land use characteristics, and public transit availability.
User Input Files
Adjustment for Household Drivers (region_hh_driver_adjust_prop.csv)
This file is optional and can be used to adjust the estimate of household drivers by age cohort. The file specifies the relative driver licensing rate relative to the model estimation data year in order to account for observed or projected changes in licensing rates.
-
Drv15to19AdjProp: Target proportion of unadjusted model number of drivers 15 to 19 years old (
1= no adjustment) -
Drv20to29AdjProp: Target proportion of unadjusted model number of drivers 20 to 29 years old (
1= no adjustment) -
Drv30to54AdjProp: Target proportion of unadjusted model number of drivers 30 to 54 years old (
1= no adjustment) -
Drv55to64AdjProp: Target proportion of unadjusted model number of drivers 55 to 64 years old (
1= no adjustment) -
Drv65PlusAdjProp: Target proportion of unadjusted model number of drivers 65 or older (
1= no adjustment)
| Year | DrvPerPrsn15to19 | Drv20to29AdjProp | Drv30to54AdjProp | Drv55to64AdjProp | Drv65PlusAdjProp |
|---|---|---|---|---|---|
| 2010 | 0.8174609 | 0.9466447 | 0.9466447 | 0.9900000 | 0.9349951 |
| 2038 | 0.9091840 | 0.9091840 | 0.9091840 | 0.9508236 | 0.8979954 |
Internal Module Inputs
| Package | Module | Outputs | Description |
|---|---|---|---|
| VETransportSupply | AssignTransitService | TranRevMiPC | Ratio of annual bus-equivalent revenue-miles (i.e. revenue-miles at the same productivity - passenger miles per revenue mile - as standard bus) to urbanized area population |
| VELandUse | Calculate4DMeasures | D1B | Gross population density (people/acre) on unprotected (i.e. developable) land in zone |
| VESimHouseholds | CreateHouseholds | HhId | Household id |
| VESimHouseholds | CreateHouseholds | Age15to19 | Persons in 15 to 19 year old age group |
| VESimHouseholds | CreateHouseholds | Age20to29 | Persons in 20 to 29 year old age group |
| VESimHouseholds | CreateHouseholds | Age30to54 | Persons in 30 to 54 year old age group |
| VESimHouseholds | CreateHouseholds | Age55to64 | Persons in 55 to 64 year old age group |
| VESimHouseholds | CreateHouseholds | Age65Plus | Persons in 65 or older age group |
| VESimHouseholds | PredictIncome | Income | Total annual income of household |
| VESimHouseholds | CreateHouseholds | HHSize | Number of persons in the household |
| VELandUse | CalculateUrbanMixMeasure | IsUrbanMixNbrhd | Flag identifying whether household is (1) or is not (0) in urban mixed-use neighborhood |
| VELandUse | AssignLocTypes | LocType | Location type (Urban, Town, Rural) of the place where the household resides |
Module Outputs
- Drv15to19: Number of drivers 15 to 19 years old
- Drv20to29: Number of drivers 20 to 29 years old
- Drv30to54: Number of drivers 30 to 54 years old
- Drv55to64: Number of drivers 55 to 64 years old
- Drv65Plus: Number of drivers 65 or older
- Drivers: Number of drivers in household
- DrvAgePersons: Number of people 15 year old or older in the household
For more information see here
4.3.16 AssignVehicleOwnership
This module determines the number of vehicles owned or leased by each household as a function of household characteristics, land use characteristics, and transportation system characteristics.
Internal Module Inputs
| Package | Module | Outputs | Description |
|---|---|---|---|
| VETransportSupply | AssignTransitService | TranRevMiPC | Ratio of annual bus-equivalent revenue-miles to urbanized area population |
| VELandUse | Calculate4DMeasures | D1B | Gross population density (people/acre) on unprotected (i.e. developable) land in zone |
| VESimHouseholds | PredictWorkers | Workers | Total workers in the household |
| VEHouseholdVehicles | AssignDrivers | Drivers | Number of drivers in household |
| VESimHouseholds | CreateHouseholds | Age65Plus | Persons in 65 or older age group |
| VELandUse | PredictHousing | HouseType | Type of dwelling unit of the household |
| VESimHouseholds | PredictIncome | Income | Total annual income of household |
| VESimHouseholds | CreateHouseholds | HHSize | Number of persons in the household |
| VELandUse | CalculateUrbanMixMeasure | IsUrbanMixNbrhd | Flag identifying whether household is (1) or is not (0) in urban mixed-use neighborhood |
| VELandUse | AssignLocTypes | LocType | Location type (Urban, Town, Rural) of the place where the household resides |
Module Outputs
- Vehicles: Number of automobiles and light trucks owned or leased by the household including high level car service vehicles available to driving-age persons
For more information see here
4.3.17 AssignVehicleType
This module identifies how many household vehicles are light trucks and how many are automobiles. Light trucks include pickup trucks, sport utility vehicles, vans, and any other vehicle not classified as a passenger car. Automobiles are vehicles classified as passenger cars.
User Input Files
Light Truck Proportion for Household Vehicles (azone_lttrk_prop.csv)
This file specifies the light truck proportion of the vehicle fleet. The user can be developed from local registration data. Alternatively, if MOVES is available for the model region, this input can be calculated from the MOVES vehicle population data (SourceTypeYear). The vehicle types used in MOVES (SourceType) correspond with the two categories of passenger vehicles used in EERPAT: MOVES SourceType 21, Passenger Car, is equivalent to autos in EERPAT and MOVES Source Type 31, Passenger Truck, is equivalent to light trucks.
- LtTrkProp: Proportion of household vehicles that are light trucks (pickup, SUV, van).
| Geo | Year | LtTrkProp |
|---|---|---|
| RVMPO | 2010 | 0.45 |
| RVMPO | 2038 | 0.34 |
Internal Module Inputs
| Package | Module | Outputs | Description |
|---|---|---|---|
| VELandUse | Calculate4DMeasures | D1B | Gross population density (people/acre) on unprotected (i.e. developable) land in zone |
| VESimHouseholds | CreateHouseholds | HhId | Household id |
| VESimHouseholds | CreateHouseholds | Age0to14 | Persons in 0 to 14 year old age group |
| VESimHouseholds | CreateHouseholds | Age15to19 | Persons in 15 to 19 year old age group |
| VEHouseholdVehicles | AssignDrivers | Drivers | Number of drivers in household |
| VEHouseholdVehicles | AssignVehicleOwnership | Vehicles | Number of automobiles and light trucks owned or leased by the household including high level car service vehicles available to driving-age persons |
| VELandUse | PredictHousing | HouseType | Type of dwelling unit of the household |
| VESimHouseholds | PredictIncome | Income | Total annual income of household |
| VESimHouseholds | CreateHouseholds | HHSize | Number of persons in the household |
| VELandUse | CalculateUrbanMixMeasure | IsUrbanMixNbrhd | Flag identifying whether household is (1) or is not (0) in urban mixed-use neighborhood |
Module Outputs
- NumLtTrk: Number of light trucks (pickup, sport-utility vehicle, and van) owned or leased by household
- NumAuto: Number of automobiles (i.e., four-tire passenger vehicles that are not light trucks) owned or leased by household
For more information see here
4.3.18 CreateVehicleTable
This module creates a vehicle table and populates it with household ID and geography fields.
4.3.18.1 User Input Files
Car Service Characteristics (azone_carsvc_characteristics.csv)
This file specifies the different characteristics for high and low car service levels by Azone. More information on car service can be found here(placeholder). Changing this input is optional and using the default input values is standard practice.
- HighCarSvcCost: Average cost in dollars per mile for travel by high service level car service exclusive of the cost of fuel, road use taxes, and carbon taxes (and any other social costs charged to vehicle use)
- LowCarSvcCost: Average cost in dollars per mile for travel by low service level car service exclusive of the cost of fuel, road use taxes, and carbon taxes (and any other social costs charged to vehicle use)
- AveCarSvcVehicleAge: Average age of car service vehicles in years
- LtTrkCarSvcSubProp: The proportion of light-truck owners who would substitute a less-costly car service option for owning their light truck
- AutoCarSvcSubProp: The proportion of automobile owners who would substitute a less-costly car service option for owning their automobile
Here is a snapshot of the file:
| Geo | Year | HighCarSvcCost.2010 | LowCarSvcCost.2010 | AveCarSvcVehicleAge | LtTrkCarSvcSubProp | AutoCarSvcSubProp |
|---|---|---|---|---|---|---|
| RVMPO | 2010 | 1 | 3 | 3 | 0.75 | 1 |
| RVMPO | 2038 | 1 | 3 | 3 | 0.75 | 1 |
Internal Module Inputs
| Package | Module | Outputs | Description |
|---|---|---|---|
| VEHouseholdVehicles | AssignVehicleOwnership | Vehicles | Number of automobiles and light trucks owned or leased by the household including high level car service vehicles available to driving-age persons |
| VEHouseholdVehicles | AssignDrivers | DrvAgePersons | Number of people 15 year old or older in the household |
| VELandUse | AssignCarSvcAvailability | CarSvcLevel | Level of car service availability for household. High means access is competitive with household owned car. Low is not competitive. |
Module Outputs
- VehId: Unique vehicle ID
-
VehicleAccess: Identifier whether vehicle is owned by household (
Own), if vehicle is low level car service (LowCarSvc), or if vehicle is high level car service (HighCarSvc)
For more information see here
4.3.19 AssignVehicleAge
This module assigns vehicle ages to each household vehicle. Vehicle age is assigned as a function of the vehicle type (auto or light truck), household income, and assumed mean vehicle age by vehicle type and Azone. Car service vehicles are assigned an age based on input assumptions with no distinction between vehicle type.
User Input Files
Vehicles Mean Age (azone_hh_veh_mean_age.csv)
This file provides inputs for mean auto age and mean light truck age by Azone. The user can develop this file using State DMV data.
- AutoMeanAge: Mean age of automobiles owned or leased by households.
- LtTrkMeanAge: Mean age of light trucks owned or leased by households.
| Geo | Year | AutoMeanAge | LtTrkMeanAge |
|---|---|---|---|
| RVMPO | 2010 | 10.8 | 10.5 |
| RVMPO | 2038 | 12.0 | 12.0 |
Internal Module Inputs
| Package | Module | Outputs | Description |
|---|---|---|---|
| VESimHouseholds | CreateHouseholds | HhId | Household id |
| VEHouseholdVehicles | CreateVehicleTable | VehId | Unique vehicle ID |
| VESimHouseholds | PredictIncome | Income | Total annual income of household |
| VEHouseholdVehicles | AssignVehicleOwnership | Vehicles | Number of automobiles and light trucks owned or leased by the household including high level car service vehicles available to driving-age persons |
| VEHouseholdVehicles | AssignVehicleType | NumLtTrk | Number of light trucks (pickup, sport-utility vehicle, and van) owned or leased by household |
| VEHouseholdVehicles | AssignVehicleType | NumAuto | Number of automobiles (i.e. 4-tire passenger vehicles that are not light trucks) owned or leased by household |
| VEHouseholdVehicles | CreateVehicleTable | VehicleAccess | Identifier whether vehicle is owned by household (Own), if vehicle is low level car service (LowCarSvc), or if vehicle is high level car service (HighCarSvc) |
Module Outputs
- Type: Vehicle body type: Auto = automobile, LtTrk = light trucks (i.e. pickup, SUV, Van)
- Age: Vehicle age in years
For more information see here
4.3.20 CalculateVehicleOwnCost
This module calculates average vehicle ownership cost for each vehicle based on the vehicle type and age using data from the American Automobile Association (AAA). To this are added the cost of parking at the vehicle residence if free parking is not available for all household vehicles. The ownership cost is converted into an average ownership cost per mile by predicting the household DVMT, given the number of owned vehicles and splitting the miles equally among each vehicle.
User Input Files
Vehicle Ownership Taxes (azone_hh_veh_own_taxes.csv)
This file provides inputs for flat fees/taxes (i.e. annual cost per vehicle) and ad valorem taxes (i.e. percentage of vehicle value paid in taxes).
- VehOwnFlatRateFee: Annual flat rate tax per vehicle in dollars
- VehOwnAdValoremTax: Annual proportion of vehicle value paid in taxes
| Geo | Year | VehOwnFlatRateFee.2015 | VehOwnAdValoremTax |
|---|---|---|---|
| RVMPO | 2010 | 50 | 0.00 |
| RVMPO | 2038 | 0 | 0.01 |
Proportion of Pay-as-you-drive (PAYD) Insurance (azone_payd_insurance_prop.csv)
This file provides inputs on the proportion of households having PAYD insurance.
- PaydHhProp: Proportion of households in the Azone who have pay-as-you-drive insurance for their vehicles
| Geo | Year | PaydHhProp |
|---|---|---|
| RVMPO | 2010 | 0.01 |
| RVMPO | 2038 | 0.50 |
Internal Module Inputs
| Package | Module | Outputs | Description |
|---|---|---|---|
| VESimHouseholds | CreateHouseholds | HhId | Household id |
| VEHouseholdVehicles | CreateVehicleTable | VehId | Unique vehicle ID |
| VEHouseholdVehicles | CreateVehicleTable | VehicleAccess | Identifier whether vehicle is owned by household (Own), if vehicle is low level car service (LowCarSvc), or if vehicle is high level car service (HighCarSvc) |
| VEHouseholdVehicles | AssignVehicleAge | Type | Vehicle body type: Auto = automobile, LtTrk = light trucks (i.e. pickup, SUV, Van) |
| VEHouseholdVehicles | AssignVehicleAge | Age | Vehicle age in years |
| VELandUse | AssignParkingRestrictions | FreeParkingSpaces | Number of free parking spaces available to the household |
| VELandUse | AssignParkingRestrictions | ParkingUnitCost | Daily cost for long-term parking (e.g. paid on monthly basis) |
| VEHouseholdVehicles | AssignDrivers | Drivers | Number of drivers in household |
| VEHouseholdVehicles | AssignDrivers | Drv15to19 | Number of drivers 15 to 19 years old |
| VEHouseholdVehicles | AssignDrivers | Drv20to29 | Number of drivers 20 to 29 years old |
| VEHouseholdVehicles | AssignDrivers | Drv30to54 | Number of drivers 30 to 54 years old |
| VEHouseholdVehicles | AssignDrivers | Drv55to64 | Number of drivers 55 to 64 years old |
| VEHouseholdVehicles | AssignDrivers | Drv65Plus | Number of drivers 65 and older |
| VESimHouseholds | PredictIncome | Income | Total annual income of household |
| VELandUse | AssignLocTypes | LocType | Location type (Urban, Town, Rural) of the place where the household resides |
| VEHouseholdVehicles | AssignVehicleType | NumLtTrk | Number of light trucks (pickup, sport-utility vehicle, and van) owned or leased by household |
| VEHouseholdVehicles | AssignVehicleType | NumAuto | Number of automobiles (i.e. 4-tire passenger vehicles that are not light trucks) owned or leased by household |
Module Outputs
- OwnCost: Annual cost of vehicle ownership including depreciation, financing, insurance, taxes, and residential parking in dollars
- OwnCostPerMile: Annual cost of vehicle ownership per mile of vehicle travel (dollars per mile)
- InsCost: Annual vehicle insurance cost in dollars
- HasPaydIns: Identifies whether household has pay-as-you-drive insurance for vehicles: 1 = Yes, 0 = no
For more information see here
4.3.21 AdjustVehicleOwnership
This module adjusts household vehicle ownership based on a comparison of the cost of owning a vehicle per mile of travel compared to the cost per mile of using a car service in locations where the level of car service quality is high. The determination of whether car services are substituted for ownership also depends on input assumptions regarding the average likelihood that an owner would substitute car services for a household vehicle.
User Input Files
- (duplicate?) Car service characteristics for
Azone(azone_carsvc_characteristics.csv): This file specifies the different characteristics for high and low car service levels- HighCarSvcCost: Average cost in dollars per mile for travel by high service level car service
- LowCarSvcCost: Average cost in dollars per mile for travel by low service level car service
- AveCarSvcVehicleAge: Average age of car service vehicles in years
- LtTrkCarSvcSubProp: The proportion of light-truck owners who would substitute a less-costly car service option for owning their light truck
- AutoCarSvcSubProp: The proportion of automobile owners who would substitute a less-costly car service option for owning their automobile

Internal Module Inputs
| Package | Module | Outputs | Description |
|---|---|---|---|
| VESimHouseholds | CreateHouseholds | HhId | Household id |
| VEHouseholdVehicles | CreateVehicleTable | VehId | Unique vehicle ID |
| VEHouseholdVehicles | AssignVehicleOwnership | Vehicles | Number of automobiles and light trucks owned or leased by the household including high level car service vehicles available to driving-age persons |
| VEHouseholdVehicles | CreateVehicleTable | VehicleAccess | Identifier whether vehicle is owned by household (Own), if vehicle is low level car service (LowCarSvc), or if vehicle is high level car service (HighCarSvc) |
| VEHouseholdVehicles | AssignVehicleType | NumLtTrk | Number of light trucks (pickup, sport-utility vehicle, and van) owned or leased by household |
| VEHouseholdVehicles | AssignVehicleType | NumAuto | Number of automobiles (i.e. 4-tire passenger vehicles that are not light trucks) owned or leased by household |
| VELandUse | AssignCarSvcAvailability | CarSvcLevel | Level of car service availability for household. High means access is competitive with household owned car. Low is not competitive. |
| VEHouseholdVehicles | AssignVehicleAge | Type | Vehicle body type: Auto = automobile, LtTrk = light trucks (i.e. pickup, SUV, Van) |
| VEHouseholdVehicles | AssignVehicleAge | Age | Vehicle age in years |
| ouseholdVehicles | CalculateVehicleOwnCost | OwnCost | Annual cost of vehicle ownership including depreciation, financing, insurance, taxes, and residential parking in dollars |
| VEHouseholdVehicles | CalculateVehicleOwnCost | OwnCostPerMile | Annual cost of vehicle ownership per mile of vehicle travel (dollars per mile) |
| VEHouseholdVehicles | CalculateVehicleOwnCost | InsCost | Annual vehicle insurance cost in dollars |
Module Outputs
-
VehicleAccess: Identifier whether vehicle is owned by household (Own), if vehicle is low level car service (
LowCarSvc), or if vehicle is high level car service (HighCarSvc) - OwnCost: Annual cost of vehicle ownership per mile of vehicle travel (dollars per mile)
- OwnCostPerMile:Annual cost of vehicle ownership per mile of vehicle travel (dollars per mile)
- InsCost: Annual vehicle insurance cost in dollars
- SwitchToCarSvc: Identifies whether a vehicle was switched from owned to car service
- OwnCostSavings: Annual vehicle ownership cost (depreciation, finance, insurance, taxes) savings in dollars resulting from substituting the use of car services for a household vehicle
- OwnCost:Annual household vehicle ownership cost (depreciation, finance, insurance, taxes) savings in dollars
- Vehicles:Number of automobiles and light trucks owned or leased by the household including high level car service vehicles available to driving-age persons
- NumLtTrk:Number of light trucks (pickup, sport-utility vehicle, and van) owned or leased by household
- NumAuto:Number of automobiles (i.e. 4-tire passenger vehicles that are not light trucks) owned or leased by household
- NumHighCarSvc:Number of high level service car service vehicles available to the household (difference between number of vehicles owned by the household and number of driving age persons for households having availability of high level car services
For more information see here
4.3.22 CalculateHouseholdDvmt
This module models household average daily vehicle miles traveled as a function of household characteristics, vehicle ownership, and attributes of the neighborhood and metropolitan area where the household resides.
Internal Module Inputs
| Package | Module | Outputs | Description |
|---|---|---|---|
| VETransportSupply | AssignTransitService | TranRevMiPC | Ratio of annual bus-equivalent revenue-miles (i.e. revenue-miles at the same productivity - passenger miles per revenue mile - as standard bus) to urbanized area population |
| VETransportSupply | AssignRoadMiles | FwyLaneMiPC | Ratio of urbanized area freeway and expressway lane-miles to urbanized area population |
| VELandUse | Calculate4DMeasures | D1B | Gross population density (people/acre) on unprotected (i.e., developable) land in zone |
| VESimHouseholds | CreateHouseholds | Age0to14 | Persons in 0 to 14 year old age group |
| VEHouseholdVehicles | AssignDrivers | Drivers | Number of drivers in household |
| VESimHouseholds | PredictWorkers | Workers | Total workers in the household |
| VESimHouseholds | CreateHouseholds | HHSize | Number of persons in the household |
| VELandUse | AssignLocTypes | LocType | Location type (Urban, Town, Rural) of the place where the household resides |
| VEHouseholdVehicles | AssignVehicleOwnership | Vehicles | Number of automobiles and light trucks owned or leased by the household including high level car service vehicles available to driving-age persons |
| VESimHouseholds | PredictIncome | Income | Total annual income of household |
| VELandUse | CalculateUrbanMixMeasure | IsUrbanMixNbrhd | Flag identifying whether household is (1) or is not (0) in urban mixed-use neighborhood |
Module Outputs
- Dvmt: Average daily vehicle miles traveled by the household in autos or light trucks
-
UrbanHhDvmt: Average daily vehicle miles traveled in autos or light trucks by households residing in the urbanized portion of the
Marea -
TownHhDvmt: Average daily vehicle miles traveled in autos or light trucks by households residing in town (urban but not urbanized) portion of the
Marea -
RuralHhDvmt: Average daily vehicle miles traveled in autos or light trucks by households residing in the rural (non-urban) portion of the
Marea
For more information see here
4.3.23 CalculateAltModeTrips
This module calculates household transit trips, walk trips, and bike trips. The models are sensitive to household DVMT so they are run after all household DVMT adjustments (e.g. to account for cost on household DVMT) are made.
Internal Module Inputs
| Package | Module | Outputs | Description |
|---|---|---|---|
| VETransportSupply | AssignTransitService | TranRevMiPC | Ratio of annual bus-equivalent revenue-miles (i.e. revenue-miles at the same productivity - passenger miles per revenue mile - as standard bus) to urbanized area population |
| VELandUse | Calculate4DMeasures | D1B | Gross population density (people/acre) on unprotected (i.e. developable) land in zone |
| VESimHouseholds | CreateHouseholds | Age15to19 | Persons in 15 to 19 year old age group |
| VESimHouseholds | CreateHouseholds | Age20to29 | Persons in 20 to 29 year old age group |
| VESimHouseholds | CreateHouseholds | Age30to54 | Persons in 30 to 54 year old age group |
| VESimHouseholds | CreateHouseholds | Age55to64 | Persons in 55 to 64 year old age group |
| VESimHouseholds | CreateHouseholds | Age65Plus | Persons in 65 or older age group |
| VESimHouseholds | CreateHouseholds | Age0to14 | Persons in 0 to 14 year old age group |
| VESimHouseholds | CreateHouseholds | HHSize | Number of persons in the household |
| VELandUse | AssignLocTypes | LocType | Location type (Urban, Town, Rural) of the place where the household resides |
| VEHouseholdVehicles | AssignVehicleOwnership | Vehicles | Number of automobiles and light trucks owned or leased by the household including high level car service vehicles available to driving-age persons |
| VESimHouseholds | PredictIncome | Income | Total annual income of household |
| VELandUse | CalculateUrbanMixMeasure | IsUrbanMixNbrhd | Flag identifying whether household is (1) or is not (0) in urban mixed-use neighborhood |
| VEHouseholdTravel | CalculateHouseholdDvmt | Dvmt | Average daily vehicle miles traveled by the household in autos or light trucks |
4.3.23.1 Module Outputs
- WalkTrips: Average number of walk trips per year by household members
- BikeTrips: Average number of bicycle trips per year by household members
- TransitTrips:Average number of public transit trips per year by household members
For more information see here
4.3.24 CalculateVehicleTrips
This module calculates average daily vehicle trips for households consistent with the household DVMT. An average trip length model is applied to estimate average length of household trips reflecting the characteristics of the household and the place where they live. The average trip length is divided into the average household DVMT to get an estimate of average number of daily vehicle trips.
Internal Module Inputs
| Package | Module | Outputs | Description |
|---|---|---|---|
| VETransportSupply | AssignRoadMiles | FwyLaneMiPC | Ratio of urbanized area freeway and expressway lane-miles to urbanized area population |
| VELandUse | Calculate4DMeasures | D1B | Gross population density (people/acre) on unprotected (i.e. developable) land in zone |
| VESimHouseholds | CreateHouseholds | HHSize | Number of persons in the household |
| VELandUse | AssignLocTypes | LocType | Location type (Urban, Town, Rural) of the place where the household resides |
| VEHouseholdVehicles | AssignVehicleOwnership | Vehicles | Number of automobiles and light trucks owned or leased by the household including high level car service vehicles available to driving-age persons |
| VEHouseholdVehicles | AssignDrivers | Drivers | Number of drivers in household |
| VESimHouseholds | PredictIncome | Income | Total annual income of household |
| VELandUse | CalculateUrbanMixMeasure | IsUrbanMixNbrhd | Flag identifying whether household is (1) or is not (0) in urban mixed-use neighborhood |
| VEHouseholdTravel | CalculateHouseholdDvmt | Dvmt | Average daily vehicle miles traveled by the household in autos or light trucks |
Module Outputs
- VehicleTrips: Average number of vehicle trips per day by household members
- AveVehTripLen: Average household vehicle trip length in miles
For more information see here
4.3.25 DivertSovTravel
This module reduces household single-occupant vehicle (SOV) travel to achieve goals that are inputs to the model. The purpose of this module is to enable users to do ‘what if’ analysis of the potential of light-weight vehicles (e.g. bicycles, electric bikes, electric scooters) and infrastructure to support their use to reduce SOV travel.
Note: SOV DVMT reduction is only applied to households in urban and town location types (LocTypes) because it is unlikely that actions/services could be provided in rural areas that could significantly divert SOV DVMT to bicycles, electric bicycles, scooters or other similar modes.
4.3.25.1 User Input Files
4.3.25.1.1 Proportion of Diverted SOV Travel (azone_prop_sov_dvmt_diverted.csv)
This file provides inputs for a goal for diverting a portion of SOV travel within a 20-mile tour distance (round trip distance). The user can use local household travel survey data (if available) to develop this input.
- PropSovDvmtDiverted: Goals for the proportion of household DVMT in single occupant vehicle tours with round-trip distances of 20 miles or less be diverted to bicycling or other slow speed modes of travel
| Geo | Year | PropSovDvmtDiverted |
|---|---|---|
| RVMPO | 2010 | 0.04 |
| RVMPO | 2038 | 0.80 |
Internal Module Inputs
| Package | Module | Outputs | Description |
|---|---|---|---|
| VETransportSupply | AssignRoadMiles | FwyLaneMiPC | Ratio of urbanized area freeway and expressway lane-miles to urbanized area population |
| VELandUse | Calculate4DMeasures | D1B | Gross population density (people/acre) on unprotected (i.e. developable) land in zone |
| VESimHouseholds | CreateHouseholds | HHSize | Number of persons in the household |
| VELandUse | AssignLocTypes | LocType | Location type (Urban, Town, Rural) of the place where the household resides |
| VEHouseholdVehicles | AssignVehicleOwnership | Vehicles | Number of automobiles and light trucks owned or leased by the household including high level car service vehicles available to driving-age persons |
| VEHouseholdVehicles | AssignDrivers | Drivers | Number of drivers in household |
| VESimHouseholds | PredictIncome | Income | Total annual income of household |
| VELandUse | CalculateUrbanMixMeasure | IsUrbanMixNbrhd | Flag identifying whether household is (1) or is not (0) in urban mixed-use neighborhood |
| VEHouseholdTravel | CalculateHouseholdDvmt | Dvmt | Average daily vehicle miles traveled by the household in autos or light trucks |
| VESimHouseholds | CreateHouseholds | Age0to14 | Persons in 0 to 14 year old age group |
| VESimHouseholds | CreateHouseholds | Age15to19 | Persons in 15 to 19 year old age group |
| VELandUse | PredictHousing | HouseType | Type of dwelling unit of the household |
Module Outputs
- PropDvmtDiverted: Proportion of household DVMT diverted to bicycling, electric bikes, or other ‘low-speed’ travel modes
- AveTrpLenDiverted: Average length in miles of vehicle trips diverted to bicycling, electric bikes, or other ‘low-speed’ travel modes
For more information see here
4.3.26 Initialize-vepowertrainsandfuels
This module processes vehicle and fuel characteristics files that model users may optionally supply. When these files are supplied, modules in the package that compute carbon intensities of vehicle travel will use the user-supplied data instead of the datasets that are part of the package (see the LoadDefaultValues.R script).
User Input Files
Carbon Intensity of Electricity (azone_electricity_carbon_intensity.csv)
This input file specifies the carbon intensity of electricity by Azone. This input file is OPTIONAL and is only needed if the user wants to modify the carbon intensity of electricity.
- ElectricityCI: Carbon intensity of electricity at point of consumption (grams CO2e per megajoule)
Here is a snapshot of the file:
| Geo | Year | ElectricityCI |
|---|---|---|
| RVMPO | 2010 | 153 |
| RVMPO | 2038 | 23 |
Average Fuel Carbon Intensity of Transit (marea_transit_ave_fuel_carbon_intensity.csv)
This input file is OPTIONAL. It is only needed if the user wants to modify the average carbon intensity of fuel used by transit.
- TransitVanFuelCI: Average carbon intensity of fuel used by transit vans (grams CO2e per megajoule)
- TransitBusFuelCI: Average carbon intensity of fuel used by transit buses (grams CO2e per megajoule)
- TransitRailFuelCI: Average carbon intensity of fuel used by transit rail vehicles (grams CO2e per megajoule)
| Geo | Year | TransitVanFuelCI | TransitBusFuelCI | TransitRailFuelCI |
|---|---|---|---|---|
| RVMPO | 2010 | 90.38 | NA | NA |
| RVMPO | 2038 | 72.30 | NA | NA |
Biofuels Proportions of Transit Fuels (marea_transit_biofuel_mix.csv)
This input file is OPTIONAL. It is only needed if the user wants to modify the biofuel used by transit services.
- TransitEthanolPropGasoline: Ethanol proportion of gasoline used by transit vehicles
- TransitBiodieselPropDiesel: Biodiesel proportion of diesel used by transit vehicles
- TransitRngPropCng: Renewable natural gas proportion of compressed natural gas used by transit vehicles
| Geo | Year | TransitEthanolPropGasoline | TransitBiodieselPropDiesel | TransitRngPropCng |
|---|---|---|---|---|
| RVMPO | 2010 | 0.1 | 0.05 | 0 |
| RVMPO | 2038 | 0.1 | 0.05 | 0 |
Transit Fuels Proportions by Transit Vehicle Type (marea_transit_fuel.csv)
This input file is OPTIONAL. It is only needed if the user wants to modify the transit fuels proportions.
- VanPropDiesel: Proportion of non-electric transit van travel powered by diesel
- VanPropGasoline: Proportion of non-electric transit van travel powered by gasoline
- VanPropCng: Proportion of non-electric transit van travel powered by compressed natural gas
- BusPropDiesel: Proportion of non-electric transit bus travel powered by diesel
- BusPropGasoline: Proportion of non-electric transit bus travel powered by gasoline
- BusPropCng: Proportion of non-electric transit bus travel powered by compressed natural gas
- RailPropDiesel: Proportion of non-electric transit rail travel powered by diesel
- RailPropGasoline: Proportion of non-electric transit rail travel powered by gasoline
| Geo | Year | VanPropDiesel | VanPropGasoline | VanPropCng | BusPropDiesel | BusPropGasoline | BusPropCng | RailPropDiesel | RailPropGasoline |
|---|---|---|---|---|---|---|---|---|---|
| RVMPO | 2010 | 0 | 1 | 0 | 0.2 | 0 | 0.8 | 1 | 0 |
| RVMPO | 2038 | 0 | 1 | 0 | 0.2 | 0 | 0.8 | 1 | 0 |
4.3.26.0.1 Transit Powertrain Proportions by Transit Vehicle Type (marea_transit_powertrain_prop.csv)
This input file is OPTIONAL. It is only needed if the user wants to modify the mixes of transit vehicle powertrains.
- VanPropIcev: Proportion of transit van travel using internal combustion engine powertrains
- VanPropHev: Proportion of transit van travel using hybrid electric powertrains
- VanPropBev: Proportion of transit van travel using battery electric powertrains
- BusPropIcev: Proportion of transit bus travel using internal combustion engine powertrains
- BusPropHev: Proportion of transit bus travel using hybrid electric powertrains
- BusPropBev: Proportion of transit bus travel using battery electric powertrains
- RailPropIcev: Proportion of transit rail travel using internal combustion engine powertrains
- RailPropHev: Proportion of transit rail travel using hybrid electric powertrains
- RailPropEv: Proportion of transit rail travel using electric powertrains
| Geo | Year | VanPropIcev | VanPropHev | VanPropBev | BusPropIcev | BusPropHev | BusPropBev | RailPropIcev | RailPropHev | RailPropEv |
|---|---|---|---|---|---|---|---|---|---|---|
| RVMPO | 2010 | 1 | 0 | 0 | 1 | 0 | 0 | 0 | 0 | 1 |
| RVMPO | 2038 | 1 | 0 | 0 | 1 | 0 | 0 | 0 | 0 | 1 |
4.3.26.0.2 Average Carbon Intensities of Fuels (region_ave_fuel_carbon_intensity.csv)
This input file is OPTIONAL. It is only needed if the user wants to modify the average carbon density for different vehicle types for the model region.
- HhFuelCI: Average carbon intensity of fuels used by household vehicles (grams CO2e per megajoule)
- CarSvcFuelCI: Average carbon intensity of fuels used by car service vehicles (grams CO2e per megajoule)
- ComSvcFuelCI: Average carbon intensity of fuels used by commercial service vehicles (grams CO2e per megajoule)
- HvyTrkFuelCI: Average carbon intensity of fuels used by heavy trucks (grams CO2e per megajoule)
- TransitVanFuelCI: Average carbon intensity of fuels used by transit vans (grams CO2e per megajoule)
- TransitBusFuelCI: Average carbon intensity of fuels used by transit buses (grams CO2e per megajoule)
- TransitRailFuelCI: Average carbon intensity of fuels used by transit rail vehicles (grams CO2e per megajoule)
| Geo | Year | HhFuelCI | CarSvcFuelCI | ComSvcFuelCI | HvyTrkFuelCI | TransitVanFuelC | TransitBusFuelC | TransitRailFuel |
|---|---|---|---|---|---|---|---|---|
| RVMPO | 2010 | 90.23 | 90.23 | 90.23 | NA | NA | NA | NA |
| RVMPO | 2038 | 72.30 | 72.30 | 72.30 | NA | NA | NA | NA |
4.3.26.0.3 Car Service Vehicle Powertrains (region_carsvc_powertrain_prop.csv)
This input file is OPTIONAL. It is only needed if the user wants to modify the powertrain proportion of car services.
- CarSvcAutoPropIcev: Proportion of car service automobile travel powered by internal combustion engine powertrains
- CarSvcAutoPropHev: Proportion of car service automobile travel powered by hybrid electric powertrains
- CarSvcAutoPropBev: Proportion of car service automobile travel powered by battery electric powertrains
- CarSvcLtTrkPropIcev: Proportion of car service light truck travel powered by internal combustion engine powertrains
- CarSvcLtTrkPropHev: Proportion of car service light truck travel powered by hybrid electric powertrains
- CarSvcLtTrkPropBev: Proportion of car service light truck travel powered by battery electric powertrains
| Geo | Year | CarSvcAutoPropIcev | CarSvcAutoPropHev | CarSvcAutoPropBev | CarSvcLtTrkPropIce | CarSvcLtTrkPropHev | CarSvcLtTrkPropBev |
|---|---|---|---|---|---|---|---|
| RVMPO | 2010 | 0.990 | 0.010 | 0.000 | 1.0000 | 0.0000 | 0.0000 |
| RVMPO | 2038 | 0.441 | 0.528 | 0.031 | 0.5335 | 0.4572 | 0.0093 |
4.3.26.0.4 Commercial Service Vehicle Powertrains (region_comsvc_powertrain_prop.csv)
This input file is OPTIONAL. It is only needed if the user wants to modify the powertrain proportion of commercial vehicles.
- ComSvcAutoPropIcev: Proportion of commercial service automobile travel powered by internal combustion engine powertrains
- ComSvcAutoPropHev: Proportion of commercial service automobile travel powered by hybrid electric powertrains
- ComSvcAutoPropBev: Proportion of commercial service automobile travel powered by battery electric powertrains
- ComSvcLtTrkPropIcev: Proportion of commercial service light truck travel powered by internal combustion engine powertrains
- ComSvcLtTrkPropHev: Proportion of commercial service light truck travel powered by hybrid electric powertrains
- ComSvcLtTrkPropBev: Proportion of commercial service light truck travel powered by battery electric powertrainss
| Geo | Year | ComSvcAutoPropIcev | ComSvcAutoPropHev | ComSvcAutoPropBev | ComSvcLtTrkPropIcev | ComSvcLtTrkPropHev | ComSvcLtTrkPropBev |
|---|---|---|---|---|---|---|---|
| RVMPO | 2010 | 0.990 | 0.010 | 0.000 | 1.0000 | 0.0000 | 0.0000 |
| RVMPO | 2038 | 0.441 | 0.528 | 0.031 | 0.5335 | 0.4572 | 0.0093 |
4.3.26.0.5 Heavy duty Truck Powertrains (region_hvytrk_powertrain_prop.csv)
This input file is OPTIONAL. It is only needed if the user wants to modify the powertrain proportion of heavy duty trucks.
- HvyTrkPropIcev: Proportion of heavy truck travel powered by internal combustion engine powertrains
- HvyTrkPropHev: Proportion of heavy truck travel powered by hybrid electric powertrains
- HvyTrkPropBev: Proportion of heavy truck travel powered by battery electric powertrains
| Geo | Year | HvyTrkPropIcev | HvyTrkPropHev | HvyTrkPropBev |
|---|---|---|---|---|
| RVMPO | 2010 | 1.0 | 0.0 | 0.0 |
| RVMPO | 2038 | 0.4 | 0.4 | 0.2 |
Module Outputs
This module produces no datasets to store in the datastore.
For more information see here
4.3.27 CalculateCarbonIntensity
This module calculates the average carbon intensity of fuels (grams CO2e per megajoule) by transportation mode and vehicle type. The transportation modes and vehicle types are:
| Mode | Vehicle Types |
|---|---|
| Household | automobile, light truck |
| Car Service | automobile, light truck |
| Commercial Service | automobile, light truck |
| Heavy Truck | heavy truck |
| Public Transit | van, bus, rail |
Average fuel carbon intensities for public transit vehicles are calculated by Marea. The average fuel carbon intensities for the other mode vehicles are calculated for the entire model region. The module also calculates the average carbon intensity of electricity at the Azone level. Note that this module uses the user input files only if the user runs Initialize module. Otherwise the module uses default inputs in the instfolder.
User Input Files
4.3.27.0.1 Carbon Intensity of Electricity (azone_electricity_carbon_intensity.csv)
This input file is OPTIONAL. It is only needed if the user wants to modify the carbon intensity of electricity.
- ElectricityCI: Carbon intensity of electricity at point of consumption (grams CO2e per megajoule)
| Geo | Year | ElectricityCI |
|---|---|---|
| RVMPO | 2010 | 153 |
| RVMPO | 2038 | 23 |
Module Outputs
- ElectricityCI: Carbon intensity of electricity at point of consumption (grams CO2e per megajoule)
- HhAutoFuelCI: Average carbon intensity of fuels used by household automobiles (grams CO2e per megajoule)
- HhLtTrkFuelCI: Average carbon intensity of fuels used by household light trucks (grams CO2e per megajoule)
- CarSvcAutoFuelCI: Average carbon intensity of fuels used by car service automobiles (grams CO2e per megajoule)
- CarSvcLtTrkFuelCI: Average carbon intensity of fuels used by car service light trucks (grams CO2e per megajoule)
- ComSvcAutoFuelCI: Average carbon intensity of fuels used by commercial service automobiles (grams CO2e per megajoule)
- ComSvcLtTrkFuelCI: Average carbon intensity of fuels used by commercial service light trucks (grams CO2e per megajoule)
- HvyTrkFuelCI: Average carbon intensity of fuels used by heavy trucks (grams CO2e per megajoule)
- TransitVanFuelCI: Average carbon intensity of fuel used by transit vans (grams CO2e per megajoule)
- TransitBusFuelCI: Average carbon intensity of fuel used by transit buses (grams CO2e per megajoule)
- TransitRailFuelCI: Average carbon intensity of fuel used by transit rail vehicles (grams CO2e per megajoule)
For more information see here
4.3.28 AssignHhVehiclePowertrain
This module assigns a powertrain type to each household vehicle. The powertrain types are internal combustion engine vehicle (ICEV), hybrid electric vehicle (HEV), plug-in hybrid electric vehicle (PHEV), and battery electric vehicles (BEV). The module also assigns related characteristics to household vehicles including:
Battery range (for PHEV and BEV)
Miles per gallon (MPG) and gallons per mile (GPM)
Miles per kilowatt-hour (MPKWH) and kilowatt-hours per mile (KWHPM)
Miles per gasoline gallon equivalent (MPGe)
The proportion of DVMT powered by electricity
Carbon dioxide equivalent emissions per mile powered by hydrocarbon fuel
Carbon dioxide equivalent emissions per mile powered by electricity
User Input Files
Charging Availability (azone_charging_availability.csv)
This input file supplies data on proportion of different household types with plug-in electric vehicle (PEV) charging available by Azone.
- PropSFChargingAvail: Proportion of single-family dwellings in Azone that have PEV charging facilities installed or able to be installed
- PropMFChargingAvail: Proportion of multifamily dwelling units in Azone that have PEV charging facilities available
- PropGQChargingAvail: Proportion of group quarters dwelling units in Azone that have PEV charging facilities available
| Geo | Year | PropSFChargingAvail | PropMFChargingAvail | PropGQChargingAvail |
|---|---|---|---|---|
| RVMPO | 2010 | 1 | 0.0 | 0 |
| RVMPO | 2038 | 1 | 0.2 | 0 |
Internal Module Inputs
| Package | Module | Outputs | Description |
|---|---|---|---|
| VEPowertrainsAndFuels | CalculateCarbonIntensity | ElectricityCI | Carbon intensity of electricity at point of consumption (grams CO2e per megajoule) |
| VEPowertrainsAndFuels | CalculateCarbonIntensity | HhAutoFuelCI | Average carbon intensity of fuels used by household automobiles (grams CO2e per megajoule)) |
| VEPowertrainsAndFuels | CalculateCarbonIntensity | HhLtTrkFuelCI | Average carbon intensity of fuels used by household light trucks (grams CO2e per megajoule) |
| VEPowertrainsAndFuels | CalculateCarbonIntensity | CarSvcAutoFuelCI | Average carbon intensity of fuels used by car service automobiles (grams CO2e per megajoule) |
| VEPowertrainsAndFuels | CalculateCarbonIntensity | CarSvcLtTrkFuelCI | Average carbon intensity of fuels used by car service light trucks (grams CO2e per megajoule) |
| ESimHouseholds | CreateHouseholds | HhId | Household id |
| VELandUse | AssignLocTypes | LocType | Location type (Urban, Town, Rural) of the place where the household resides |
| VEHouseholdVehicles | AssignVehicleOwnership | Vehicles | Number of automobiles and light trucks owned or leased by the household including high level car service vehicles available to driving-age persons |
| VEHouseholdVehicles | AssignVehicleType | NumAuto | Number of automobiles (i.e. 4-tire passenger vehicles that are not light trucks) owned or leased by household |
| VEHouseholdVehicles | AssignVehicleType | NumLtTrk | Number of light trucks (pickup, sport-utility vehicle, and van) owned or leased by household |
| VELandUse | PredictHousing | HouseType | Type of dwelling unit of the household |
| VEHouseholdTravel | CalculateHouseholdDvmt | Dvmt | Average daily vehicle miles traveled by the household in autos or light trucks |
| VEHouseholdVehicles | CreateVehicleTable | VehId | Unique vehicle ID |
| VEHouseholdVehicles | AssignVehicleAge | Type | Vehicle body type: Auto = automobile, LtTrk = light trucks (i.e. pickup, SUV, Van) |
| VEHouseholdVehicles | AssignVehicleAge | Age | Vehicle age in years |
| VEHouseholdVehicles | CreateVehicleTable | VehicleAccess | Identifier whether vehicle is owned by household (Own), if vehicle is low level car service (LowCarSvc), or if vehicle is high level car service (HighCarSvc) |
Module Outputs
- Powertrain: Vehicle powertrain type: ICEV = internal combustion engine vehicle, HEV = hybrid electric vehicle, PHEV = plug-in hybrid electric vehicle, BEV = battery electric vehicle, NA = not applicable because is a car service vehicle
- BatRng: Miles of travel possible on fully charged battery
- MPG: Average miles of vehicle travel powered by fuel per gasoline equivalent gallon
- GPM: Average gasoline equivalent gallons per mile of vehicle travel powered by fuel
- MPKWH: Average miles of vehicle travel powered by electricity per kilowatt-hour
- KWHPM: Average kilowatt-hours per mile of vehicle travel powered by electricity
- MPGe: Average miles of vehicle travel per gasoline equivalent gallon (fuel and electric powered)
- ElecDvmtProp: Average miles of vehicle travel per gasoline equivalent gallon (fuel and electric powered)
- FuelCO2ePM: Average grams of carbon-dioxide equivalents produced per mile of travel powered by fuel
- ElecCO2ePM: Average grams of carbon-dioxide equivalents produced per mile of travel powered by electricity
For more information see here
4.3.29 Initialize-vetravelperformance
This module reads and processes roadway DVMT and operations inputs.
The following input files are optional. If these data are not provided, the model calculates values based on default data included with the package and processed by the LoadDefaultRoadDvmtValues.R script.
User Input Files
Base Year Heavy Truck DVMT (region_base_year_dvmt.csv)
This input file is OPTIONAL. It is only needed if the user wants to adjust heavy truck DVMT for base year
- HvyTrkDvmtGrowthBasis: Factor used to grow heavy truck DVMT from base year value
- HvyTrkDvmt: Average daily vehicle miles of travel on roadways in the region by heavy trucks during he base year
- HvyTrkDvmtUrbanProp: Proportion of Region heavy truck daily vehicle miles of travel occurring on urbanized area roadways
| StateAbbrLookup | HvyTrkDvmtGrowthBasis | HvyTrkDvmt | ComSvcDvmtGrowthBasis |
|---|---|---|---|
| Income | NA | Population |
Base Year DVMT (marea_base_year_dvmt.csv)
This input file is OPTIONAL. It is only needed if the user wants to modify the adjust dvmt growth factors from base year in by Marea
- UrbanLdvDvmt: Average daily vehicle miles of travel on roadways in the urbanized portion of the Marea by light-duty vehicles during the base year
- UrbanHvyTrkDvmt: Average daily vehicle miles of travel on roadways in the urbanized portion of the Marea by heavy trucks during he base year
| Geo | UzaNameLookup | UrbanLdvDvmt | UrbanHvyTrkDvmt |
|---|---|---|---|
| RVMPO | Medford/OR | NA | NA |
DVMT Split by Road Class (marea_dvmt_split_by_road_class.csv)
This input file is OPTIONAL. It is only needed if the user wants to modify the dvmt split for different road classes. This data can be derived from the FHWA Highway Statistics data.
- LdvFwyArtDvmtProp: Proportion of light-duty daily vehicle miles of travel in the urbanized portion of the Marea occurring on freeway or aerial roadways
- LdvOthDvmtProp: Proportion of light-duty daily vehicle miles of travel in the urbanized portion of the Marea occurring on other roadways
- HvyTrkFwyDvmtProp: Proportion of heavy truck daily vehicle miles of travel in the urbanized portion of the Marea occurring on freeways
- HvyTrkArtDvmtProp: Proportion of heavy truck daily vehicle miles of travel in the urbanized portion of the Marea occurring on arterial rdways
- HvyTrkOthDvmtProp: Proportion of heavy truck daily vehicle miles of travel in the urbanized portion of the Marea occurring on other roadways
- BusFwyDvmtProp: Proportion of bus daily vehicle miles of travel in the urbanized portion of the Marea occurring on freeways
- BusArtDvmtProp: Proportion of bus daily vehicle miles of travel in the urbanized portion of the Marea occurring on arterial roadways
- BusOthDvmtProp: Proportion of bus daily vehicle miles of travel in the urbanized portion of the Marea occuring on other roadways
| Geo | LdvFwyDvmtProp | LdvArtDvmtProp | LdvOthDvmtProp | HvyTrkFwyDvmtProp | HvyTrkArtDvmtProp | HvyTrkOthDvmtProp | BusFwyDvmtProp | BusArtDvmtProp | BusOthDvmtProp |
|---|---|---|---|---|---|---|---|---|---|
| RVMPO | 0.2632296 | 0.47739 | 0.2593804 | 0 | 0.6962986 | 0.3037014 |
Operations Deployment Effects on DVMT (marea_operations_deployment.csv)
This input file is OPTIONAL. It is only needed if the user wants to modify the proportion of DVMT affected by operations for different road classes.
- RampMeterDeployProp: Proportion of freeway DVMT affected by ramp metering deployment
- IncidentMgtDeployProp: Proportion of freeway DVMT affected by incident management deployment
- SignalCoordDeployProp: Proportion of arterial DVMT affected by signal coordination deployment
- AccessMgtDeployProp: Proportion of arterial DVMT affected by access management deployment
- OtherFwyOpsDeployProp: Proportion of freeway DVMT affected by deployment of other user-defined freeway operations measures
- OtherArtOpsDeployProp: Proportion of arterial DVMT affected by deployment of other user-defined arterial operations measures
| Geo | Year | RampMeterDeployProp | IncidentMgtDeployProp | SignalCoordDeployProp | AccessMgtDeployProp | OtherFwyOpsDeployProp | OtherArtOpsDeployProp |
|---|---|---|---|---|---|---|---|
| RVMPO | 2010 | 0.00 | 0.50 | 0.50 | 0.00 | 0 | 0 |
| RVMPO | 2038 | 0.95 | 0.95 | 0.95 | 0.24 | 0 | 0 |
Other Operations Effects (other_ops_effectiveness.csv)
This input file is OPTIONAL. It is only needed if the user wants to modify the other delay effects of operations in different road classes
- Level: Congestion levels: None = none, Mod = moderate, Hvy = heavy, Sev = severe, Ext = extreme
- Art_Rcr: Percentage reduction of recurring arterial delay that would occur with full deployment of other user-defined arterial operations measures
- Art_NonRcr: Percentage reduction of non-recurring arterial delay that would occur with full deployment of other user-defined arterial operations measures
- Fwy_Rcr: Percentage reduction of recurring freeway delay that would occur with full deployment of other user-defined freeway operations measures
- Fwy_NonRcr: Percentage reduction of non-recurring freeway delay that would occur with full deployment of other user-defined freeway operations measures
| Level | Art_Rcr | Art_NonRcr | Fwy_Rcr | Fwy_NonRcr | AccessMgtDeployProp | OtherFwyOpsDeployProp | OtherArtOpsDeployProp |
|---|---|---|---|---|---|---|---|
| None | 0 | 0 | 0 | 0 | 0 | 0 | 0 |
| Mod | 0 | 0 | 0 | 0 | 0 | 0 | 0 |
| Hvy | 0 | 0 | 0 | 0 | 0 | 0 | 0 |
| sev | 0 | 0 | 0 | 0 | 0 | 0 | 0 |
| Ext | 0 | 0 | 0 | 0 | 0 | 0 | 0 |
Congestion Charges (marea_congestion_charges.csv)
This input file is OPTIONAL. It is only needed if the user wants to add a congestion charge policy for vehicle travel using different congestion levels and roadway classes.
- FwyNoneCongChg: Charge per mile (U.S. dollars) of vehicle travel on freeways during periods of no congestion
- FwyModCongChg: Charge per mile (U.S. dollars) of vehicle travel on freeways during periods of moderate congestion
- FwyHvyCongChg: Charge per mile (U.S. dollars) of vehicle travel on freeways during periods of heavy congestion
- FwySevCongChg: Charge per mile (U.S. dollars) of vehicle travel on freeways during periods of severe congestion
- FwyExtCongChg: Charge per mile (U.S. dollars) of vehicle travel on freeways during periods of extreme congestion
- ArtNoneCongChg: Charge per mile (U.S. dollars) of vehicle travel on arterials during periods of no congestion
- ArtModCongChg: Charge per mile (U.S. dollars) of vehicle travel on arterials during periods of moderate congestion
- ArtHvyCongChg: Charge per mile (U.S. dollars) of vehicle travel on arterials during periods of heavy congestion
- ArtSevCongChg: Charge per mile (U.S. dollars) of vehicle travel on arterials during periods of severe congestion
- ArtExtCongChg: Charge per mile (U.S. dollars) of vehicle travel on arterials during periods of extreme congestion
| Geo | Year | FwyNoneCongChg.2010 | FwyModCongChg.2010 | FwyHvyCongChg.2010 | FwySevCongChg.2010 | FwyExtCongChg.2010 | ArtNoneCongChg.2010 | ArtModCongChg.2010 | ArtHvyCongChg.2010 | ArtSevCongChg.2010 | ArtExtCongChg.2010 |
|---|---|---|---|---|---|---|---|---|---|---|---|
| RVMPO | 2010 | 0 | 0 | 0 | 0.0 | 0.0 | 0 | 0 | 0 | 0 | 0 |
| RVMPO | 2038 | 0 | 0 | 0 | 0.1 | 0.2 | 0 | 0 | 0 | 0 | 0 |
4.3.30 CalculateBaseRoadDvmt
This module calculates base year roadway DVMT by vehicle type (light-duty, heavy truck, bus) and the distribution of roadway DVMT by vehicle type to roadway classes (freeway, arterial, other) This module uses optional user inputs if Initialize module is run. Otherwise, it uses default data in instfolder
User Input Files
-
(duplicate) Base year highway truck dvmt for region (region_base_year_hvytrk_dvmt.csv): This input file is OPTIONAL. It is only needed if the user wants to adjust heavy truck dvmt for base year
- HvyTrkDvmtGrowthBasis: Factor used to grow heavy truck DVMT from base year value
- HvyTrkDvmt: Average daily vehicle miles of travel on roadways in the region by heavy trucks during he base year
- HvyTrkDvmtUrbanProp: Proportion of Region heavy truck daily vehicle miles of travel occurring on urbanized area roadways
Here is a snapshot of the file:

-
(duplicate) Base year dvmt for Marea (*marea_base_year_dvmt.csv**): This input file is OPTIONAL. It is only needed if the user wants to modify the adjust dvmt growth factors from base year in by Marea
- ComSvcDvmtGrowthBasis: Factor used to grow commercial service vehicle DVMT in Marea from base year value
- HvyTrkDvmtGrowthBasis: Factor used to grow heavy truck DVMT from base year value
- UrbanLdvDvmt: Average daily vehicle miles of travel on roadways in the urbanized portion of the Marea by light-duty vehicles during the base year
- UrbanHvyTrkDvmt: Average daily vehicle miles of travel on roadways in the urbanized portion of the Marea by heavy trucks during he base year
Here is a snapshot of the file:

-
DVMT split by road class by Marea (marea_dvmt_split_by_road_class.csv): This input file is OPTIONAL. It is only needed if the user wants to modify the dvmt split for different road classes.
- LdvFwyArtDvmtProp: Proportion of light-duty daily vehicle miles of travel in the urbanized portion of the Marea occurring on freeway or arterial roadways
- LdvOthDvmtProp: Proportion of light-duty daily vehicle miles of travel in the urbanized portion of the Marea occurring on other roadways
- HvyTrkFwyDvmtProp: Proportion of heavy truck daily vehicle miles of travel in the urbanized portion of the Marea occurring on freeways
- HvyTrkArtDvmtProp: Proportion of heavy truck daily vehicle miles of travel in the urbanized portion of the Marea occurring on arterial roadways
- HvyTrkOthDvmtProp: Proportion of heavy truck daily vehicle miles of travel in the urbanized portion of the Marea occurring on other roadways
- BusFwyDvmtProp: Proportion of bus daily vehicle miles of travel in the urbanized portion of the Marea occurring on freeways
- BusArtDvmtProp: Proportion of bus daily vehicle miles of travel in the urbanized portion of the Marea occurring on arterial roadways
- BusOthDvmtProp: Proportion of bus daily vehicle miles of travel in the urbanized portion of the Marea occuring on other roadways
Internal Module Inputs
| Package | Module | Outputs | Description |
|---|---|---|---|
| VETransportSupply | AssignTransitService | VanDvmt | Total daily miles traveled by vans of various sizes to provide demand responsive, vanpool, and similar services |
| VETransportSupply | AssignTransitService | BusDvmt | Total daily miles traveled by buses of various sizes to provide bus service of various types |
| VETransportSupply | AssignTransitService | RailDvmt | Total daily miles traveled by light rail, heavy rail, commuter rail, and similar types of vehicles |
| VELandUse | AssignLocTypes | UrbanPop | Urbanized area population |
| VELandUse | AssignLocTypes | RuralPop | Rural (i.e. non-urbanized area) population |
| VELandUse | AssignLocTypes | RuralIncome | Total household income of the rural (i.e. non-urbanized area) population |
| VELandUse | AssignLocTypes | UrbanIncome | Total household income of the rural (i.e. non-urbanized area) population |
| VEHouseholdTravel | CalculateHouseholdDvmt | UrbanHhDvmt | Average daily vehicle miles traveled in autos or light trucks by households residing in the urbanized portion of the Marea |
| VEHouseholdTravel | CalculateHouseholdDvmt | RuralHhDvmt | Average daily vehicle miles traveled in autos or light trucks by households residing in the rural (non-urban) portion of the Marea |
Module Outputs
- HvyTrkDvmtUrbanProp: Proportion of Region heavy truck daily vehicle miles of travel occurring on urbanized area roadways
- HvyTrkDvmtIncomeFactor: Ratio of Region base year heavy truck DVMT to household income
- HvyTrkDvmtPopulationFactor: Ratio of Region base year heavy truck DVMT to population
- HvyTrkUrbanDvmt: Base year Region heavy truck daily vehicle miles of travel in urbanized areas
- HvyTrkRuralDvmt: Base year Region heavy truck daily vehicle miles of travel in rural (i.e. non-urbanized) areas
- ComSvcDvmtHhDvmtFactor: Ratio of Marea base year commercial service DVMT to household DVMT
- ComSvcDvmtIncomeFactor: Ratio of base year commercial service vehicle DVMT to household income
- ComSvcDvmtPopulationFactor: Ratio of base year commercial service vehicle DVMT to population
- HvyTrkDvmtPopulationFactor: Ratio of base year heavy truck DVMT to population
- LdvRoadDvmtLdvDemandRatio: Ratio between light-duty vehicle (LDV) daily vehicle miles of travel (DVMT) on urbanized area roadways in the Marea to the total LDV DVMT of households residing in the urbanized area, the commercial service vehicle travel related to household demand, and LDV public transit DVMT.
- ComSvcUrbanDvmt: Commercial service daily vehicle miles of travel associated with Marea urbanized household activity
- ComSvcRuralDvmt: Commercial service daily vehicle miles of travel associated with Marea rural household activity
- LdvFwyArtDvmtProp: Proportion of light-duty daily vehicle miles of travel in the urbanized portion of the Marea occurring on freeway or arterial roadways
- LdvOthDvmtProp: Proportion of light-duty daily vehicle miles of travel in the urbanized portion of the Marea occurring on other roadways
- HvyTrkFwyDvmtProp: Proportion of heavy truck daily vehicle miles of travel in the urbanized portion of the Marea occurring on freeways
- HvyTrkArtDvmtProp: Proportion of heavy truck daily vehicle miles of travel in the urbanized portion of the Marea occurring on arterial roadways
- HvyTrkOthDvmtProp: Proportion of heavy truck daily vehicle miles of travel in the urbanized portion of the Marea occurring on other roadways
- BusFwyDvmtProp: Proportion of bus daily vehicle miles of travel in the urbanized portion of the Marea occurring on freeways
- BusArtDvmtProp: Proportion of bus daily vehicle miles of travel in the urbanized portion of the Marea occurring on arterial roadways
- BusOthDvmtProp: Proportion of bus daily vehicle miles of travel in the urbanized portion of the Marea occuring on other roadways
- LdvFwyArtDvmt: Light-duty daily vehicle miles of travel in the urbanized portion of the Marea occurring on freeway or arterial roadways
- LdvOthDvmt: Light-duty daily vehicle miles of travel in the urbanized portion of the Marea occurring on other roadways
- HvyTrkFwyDvmt: Heavy truck daily vehicle miles of travel in the urbanized portion of the Marea occurring on freeways
- HvyTrkArtDvmt:Heavy truck daily vehicle miles of travel in the urbanized portion of the Marea occurring on arterial roadways
- HvyTrkOthDvmt: Heavy truck daily vehicle miles of travel in the urbanized portion of the Marea occurring on other roadways
- BusFwyDvmt: Bus daily vehicle miles of travel in the urbanized portion of the Marea occurring on freeways
- BusArtDvmt: Bus daily vehicle miles of travel in the urbanized portion of the Marea occurring on arterial roadways
- BusOthDvmt: Bus daily vehicle miles of travel in the urbanized portion of the Marea occuring on other roadways
4.3.31 CalculateFutureRoadDvmt
This module calculates future year roadway DVMT by vehicle type (light-duty, heavy truck, bus) and the distribution of roadway DVMT by vehicle type to roadway classes (freeway, arterial, other) This module uses optional user inputs if Initialize module is run. Otherwise, it uses default data in instfolder
User Input Files
-
Base year highway truck dvmt for region (region_base_year_hvytrk_dvmt.csv): This input file is OPTIONAL. It is only needed if the user wants to adjust heavy truck dvmt for base year
- HvyTrkDvmtGrowthBasis: Factor used to grow heavy truck DVMT from base year value
-
Base year dvmt for Marea (*marea_base_year_dvmt.csv**): This input file is OPTIONAL. It is only needed if the user wants to modify the adjust dvmt growth factors from base year in by Marea
- ComSvcDvmtGrowthBasis: Factor used to grow commercial service vehicle DVMT in Marea from base year value
Here is a snapshot of the file:
Here is a snapshot of the file:
4.3.31.1 Internal Module Inputs
| Package | Module | Outputs | Description |
|---|---|---|---|
| VETravelPerformance | CalculateBaseRoadDvmt | HvyTrkDvmtIncomeFactor | Ratio of Region base year heavy truck DVMT to household income |
| vetravelperformance | CalculateBaseRoadDvmt | HvyTrkDvmtUrbanProp | proportion of region heavy truck daily vehicle miles of travel occurring on urbanized area roadways |
| VETravelPerformance | CalculateBaseRoadDvmt | HvyTrkDvmtPopulationFactor | Ratio of Region base year heavy truck DVMT to population |
| VETravelPerformance | CalculateBaseRoadDvmt | LdvFwyArtDvmtProp | Proportion of light-duty daily vehicle miles of travel in the urbanized portion of the Marea occurring on freeway or arterial roadways |
| VETravelPerformance | CalculateBaseRoadDvmt | LdvOthDvmtProp | Proportion of light-duty daily vehicle miles of travel in the urbanized portion of the Marea occurring on other roadways |
| VETravelPerformance | CalculateBaseRoadDvmt | HvyTrkFwyDvmtProp | Proportion of heavy truck daily vehicle miles of travel in the urbanized portion of the Marea occurring on freeways |
| VETravelPerformance | CalculateBaseRoadDvmt | LdvOthDvmtProp | Proportion of heavy truck daily vehicle miles of travel in the urbanized portion of the Marea occurring on freeways |
| VETravelPerformance | CalculateBaseRoadDvmt | HvyTrkFwyDvmtProp | Proportion of heavy truck daily vehicle miles of travel in the urbanized portion of the Marea occurring on arterial roadways |
| VETravelPerformance | CalculateBaseRoadDvmt | HvyTrkArtDvmtProp | Proportion of heavy truck daily vehicle miles of travel in the urbanized portion of the Marea occurring on arterial roadways |
| VETravelPerformance | CalculateBaseRoadDvmt | HvyTrkOthDvmtProp | Proportion of heavy truck daily vehicle miles of travel in the urbanized portion of the Marea occurring on other roadways |
| VETravelPerformance | CalculateBaseRoadDvmt | BusFwyDvmtProp | Proportion of bus daily vehicle miles of travel in the urbanized portion of the Marea occurring on freeways |
| VETravelPerformance | CalculateBaseRoadDvmt | BusArtDvmtProp | Proportion of bus daily vehicle miles of travel in the urbanized portion of the Marea occurring on arterial roadways |
| VETravelPerformance | CalculateBaseRoadDvmt | BusOthDvmtProp | Proportion of bus daily vehicle miles of travel in the urbanized portion of the Marea occuring on other roadways |
| VETravelPerformance | CalculateBaseRoadDvmt | ComSvcDvmtHhDvmtFactor | Ratio of Marea base year commercial service DVMT to household DVMT |
| VETravelPerformance | CalculateBaseRoadDvmt | ComSvcDvmtIncomeFactor | Ratio of base year commercial service vehicle DVMT to household income |
| VELandUse | CalculateBaseRoadDvmt | ComSvcDvmtPopulationFactor | Ratio of base year commercial service vehicle DVMT to population |
| VELandUse | CalculateBaseRoadDvmt | HvyTrkDvmtPopulationFactor | Ratio of base year heavy truck DVMT to population |
| VELandUse | CalculateBaseRoadDvmt | LdvRoadDvmtLdvDemandRatio | Ratio between light-duty vehicle (LDV) daily vehicle miles of travel (DVMT) on urbanized area roadways in the Marea to the total LDV DVMT of households residing in the urbanized area, the commercial service vehicle travel related to household demand, and LDV public transit DVMT |
| VETransportSupply | AssignTransitService | VanDvmt | Total daily miles traveled by vans of various sizes to provide demand responsive, vanpool, and similar services |
| VETransportSupply | AssignTransitService | BusDvmt | Total daily miles traveled by buses of various sizes to provide bus service of various types |
| VELandUse | AssignLocTypes | UrbanPop | Urbanized area population |
| VELandUse | AssignLocTypes | RuralPop | Rural (i.e. non-urbanized area) population |
| VELandUse | AssignLocTypes | RuralIncome | Total household income of the rural (i.e. non-urbanized area) population |
| VELandUse | AssignLocTypes | UrbanIncome | Total household income of the rural (i.e. non-urbanized area) population |
| VEHouseholdTravel | CalculateHouseholdDvmt | UrbanHhDvmt | Average daily vehicle miles traveled in autos or light trucks by households residing in the urbanized portion of the Marea |
| VEHouseholdTravel | CalculateHouseholdDvmt | RuralHhDvmt | Average daily vehicle miles traveled in autos or light trucks by households residing in the rural (non-urban) portion of the Marea |
4.3.31.2 Module Outputs
- HvyTrkUrbanDvmt: Base year Region heavy truck daily vehicle miles of travel in urbanized areas
- HvyTrkRuralDvmt: Base year Region heavy truck daily vehicle miles of travel in rural (i.e. non-urbanized) areas
- ComSvcUrbanDvmt: Commercial service daily vehicle miles of travel associated with Marea urbanized household activity
- ComSvcRuralDvmt: Commercial service daily vehicle miles of travel associated with Marea rural household activity
- LdvFwyArtDvmt: Light-duty daily vehicle miles of travel in the urbanized portion of the Marea occurring on freeway or arterial roadways
- LdvOthDvmt: Light-duty daily vehicle miles of travel in the urbanized portion of the Marea occurring on other roadways
- HvyTrkFwyDvmt: Heavy truck daily vehicle miles of travel in the urbanized portion of the Marea occurring on freeways
- HvyTrkArtDvmt:Heavy truck daily vehicle miles of travel in the urbanized portion of the Marea occurring on arterial roadways
- HvyTrkOthDvmt: Heavy truck daily vehicle miles of travel in the urbanized portion of the Marea occurring on other roadways
- BusFwyDvmt: Bus daily vehicle miles of travel in the urbanized portion of the Marea occurring on freeways
- BusArtDvmt: Bus daily vehicle miles of travel in the urbanized portion of the Marea occurring on arterial roadways
- BusOthDvmt: Bus daily vehicle miles of travel in the urbanized portion of the Marea occuring on other roadways
4.3.32 CalculateRoadPerformance
This module splits light-duty vehicle (LDV) daily vehicle miles of travel DVHT between freeways and arterials as a function of relative speeds and congestion prices. Speeds and prices are combined to calculate an average ‘effective’ speed for freeways and for arterials. The ratio of freeway and arterial ‘effective’ speeds and a split factor calculated for the metropolitan area are used to split the LDV DVMT. Iteration is used to find an equilibrium split value. In addition to the LDV freeway DVMT and arterial DVMT, the following performance measures are saved to the datastore:
Average freeway speed by congestion level;
Average arterial speed by congestion level;
Average freeway delay by congestion level;
Average arterial delay by congestion level;
Freeway DVMT proportions by congestion level;
Arterial DVMT proportions by congestion level;
Average amount paid per mile in congestion pricing fees; and,
Vehicle hours of delay by vehicle type.
User Input Files
-
Operations deployment effects on dvmt for Marea (marea_operations_deployment.csv): This input file is OPTIONAL. It is only needed if the user wants to modify the proportion of dvmt affected by operations for different road classes.
- RampMeterDeployProp: Proportion of freeway DVMT affected by ramp metering deployment
- IncidentMgtDeployProp: Proportion of freeway DVMT affected by incident management deployment
- SignalCoordDeployProp: Proportion of arterial DVMT affected by signal coordination deployment
- AccessMgtDeployProp: Proportion of arterial DVMT affected by access management deployment
- OtherFwyOpsDeployProp: Proportion of freeway DVMT affected by deployment of other user-defined freeway operations measures
- OtherArtOpsDeployProp: Proportion of arterial DVMT affected by deployment of other user-defined arterial operations measures
Here is a snapshot of the file:

-
Other operations effects (other_ops_effectiveness.csv): This input file is OPTIONAL. It is only needed if the user wants to modify the other delay effects of operations in different road classes
- Level: Congestion levels: None = none, Mod = moderate, Hvy = heavy, Sev = severe, Ext = extreme
- Art_Rcr: Percentage reduction of recurring arterial delay that would occur with full deployment of other user-defined arterial operations measures
- Art_NonRcr: Percentage reduction of non-recurring arterial delay that would occur with full deployment of other user-defined arterial operations measures
- Fwy_Rcr: Percentage reduction of recurring freeway delay that would occur with full deployment of other user-defined freeway operations measures
- Fwy_NonRcr: Percentage reduction of non-recurring freeway delay that would occur with full deployment of other user-defined freeway operations measures
Here is a snapshot of the file:

-
Charges by congestion levels by road class for Marea (marea_congestion_charges.csv): This input file is OPTIONAL. It is only needed if the user wants to modify the charges of vehicle travel for different congestion levels
- FwyNoneCongChg: Charge per mile (U.S. dollars) of vehicle travel on freeways during periods of no congestion
- FwyModCongChg: Charge per mile (U.S. dollars) of vehicle travel on freeways during periods of moderate congestion
- FwyHvyCongChg: Charge per mile (U.S. dollars) of vehicle travel on freeways during periods of heavy congestion
- FwySevCongChg: Charge per mile (U.S. dollars) of vehicle travel on freeways during periods of severe congestion
- FwyExtCongChg: Charge per mile (U.S. dollars) of vehicle travel on freeways during periods of extreme congestion
- ArtNoneCongChg: Charge per mile (U.S. dollars) of vehicle travel on arterials during periods of no congestion
- ArtModCongChg: Charge per mile (U.S. dollars) of vehicle travel on arterials during periods of moderate congestion
- ArtHvyCongChg: Charge per mile (U.S. dollars) of vehicle travel on arterials during periods of heavy congestion
- ArtSevCongChg: Charge per mile (U.S. dollars) of vehicle travel on arterials during periods of severe congestion
- ArtExtCongChg: Charge per mile (U.S. dollars) of vehicle travel on arterials during periods of extreme congestion
Here is a snapshot of the file:

User Input Parameters
Value of time (valueoftime) : This parameter set the value of time (base cost year dollars per hour). It should be defined in model_parameters.json
{"NAME": "ValueOfTime",
"VALUE": "16",
"TYPE": "double",
"UNITS": "base cost year dollars per hour"
}
Internal Module Inputs
| Package | Module | Outputs | Description |
|---|---|---|---|
| VELandUse | AssignLocTypes | UrbanPop | Urbanized area population |
| VETransportSupply | AssignRoadMiles | FwyLaneMi | Lane-miles of roadways functionally classified as freeways or expressways in the urbanized portion of the metropolitan area |
| VETravelPerformance | CalculateBaseRoadDvmt | LdvFwyArtDvmt | Light-duty daily vehicle miles of travel in the urbanized portion of the Marea occurring on freeway or arterial roadways |
| VETravelPerformance | CalculateBaseRoadDvmt | LdvOthDvmt | Light-duty daily vehicle miles of travel in the urbanized portion of the Marea occurring on freeway or arterial roadways |
| VETravelPerformance | CalculateBaseRoadDvmt | HvyTrkFwyDvmt | Heavy truck daily vehicle miles of travel in the urbanized portion of the Marea occurring on freeways |
| VETravelPerformance | CalculateBaseRoadDvmt | HvyTrkArtDvmt | Heavy truck daily vehicle miles of travel in the urbanized portion of the Marea occurring on arterial roadways |
| VETravelPerformance | CalculateBaseRoadDvmt | HvyTrkOthDvmt | Light-duty daily vehicle miles of travel in the urbanized portion of the Marea occurring on other roadways |
| VETravelPerformance | CalculateBaseRoadDvmt | BusFwyDvmt | Bus daily vehicle miles of travel in the urbanized portion of the Marea occurring on freeways |
| VETravelPerformance | CalculateBaseRoadDvmt | BusArtDvmt | Bus daily vehicle miles of travel in the urbanized portion of the Marea occurring on arterial roadways |
| VETravelPerformance | CalculateBaseRoadDvmt | BusOthDvmt | Bus daily vehicle miles of travel in the urbanized portion of the Marea occuring on other roadways |
| VELandUse | Calculate4DMeasures | UrbanArea | Area that is Urban and unprotected (i.e. developable) within the zone |
Module Outputs
- LdvFwyDvmt: Light-duty daily vehicle miles of travel in the urbanized portion of the Marea occurring on freeways
- LdvArtDvmt: Light-duty daily vehicle miles of travel in the urbanized portion of the Marea occurring on arterial roadways
- FwyNoneCongSpeed: Average freeway speed (miles per hour) when there is no congestion
- FwyModCongSpeed: Average freeway speed (miles per hour) when congestion is moderate
- FwyHvyCongSpeed: Average freeway speed (miles per hour) when congestion is heavy
- FwySevCongSpeed: Average freeway speed (miles per hour) when congestion is severe
- FwyExtCongSpeed: Average freeway speed (miles per hour) when congestion is extreme
- ArtNoneCongSpeed: Average arterial speed (miles per hour) when there is no congestion
- ArtModCongSpeed: Average arterial speed (miles per hour) when congestion is moderate
- ArtHvyCongSpeed: Average arterial speed (miles per hour) when congestion is heavy
- ArtSevCongSpeed: Average arterial speed (miles per hour) when congestion is severe
- ArtExtCongSpeed: Average arterial speed (miles per hour) when congestion is extreme
- OthSpd: Average speed (miles per hour) on other roadways
- AveLdvSpd: Average light-duty vehicle speed (miles per hour) on all roadways weighted by the proportions of light-duty vehicle travel
- FwyNoneCongDelay: Average freeway delay (hours per mile) occurring when there is no congestion
- FwyModCongDelay: Average freeway delay (hours per mile) occurring when congestion is moderate
- FwyHvyCongDelay: Average freeway delay (hours per mile) occurring when congestion is heavy
- FwySevCongDelay: Average freeway delay (hours per mile) occurring when congestion is severe
- FwyExtCongDelay: Average freeway delay (hours per mile) occurring when congestion is extreme
- ArtNoneCongDelay: Average arterial delay (hours per mile) occurring when there is no congestion
- ArtModCongDelay: Average arterial delay (hours per mile) occurring when congestion is moderate
- ArtHvyCongDelay: Average arterial delay (hours per mile) occurring when congestion is heavy
- ArtSevCongDelay: Average arterial delay (hours per mile) occurring when congestion is severe
- ArtExtCongDelay: Average arterial delay (hours per mile) occurring when congestion is extreme
- FwyDvmtPropNoneCong: Proportion of freeway DVMT occurring when there is no congestion
- FwyDvmtPropModCong: Proportion of freeway DVMT occurring when congestion is moderate
- FwyDvmtPropHvyCong: Proportion of freeway DVMT occurring when congestion is heavy
- FwyDvmtPropSevCong: Proportion of freeway DVMT occurring when congestion is severe
- FwyDvmtPropExtCong: Proportion of freeway DVMT occurring when congestion is extreme
- ArtDvmtPropNoneCong: Proportion of arterial DVMT occurring when there is no congestion
- ArtDvmtPropModCong: Proportion of arterial DVMT occurring when congestion is moderate
- ArtDvmtPropHvyCong: Proportion of arterial DVMT occurring when congestion is heavy
- ArtDvmtPropSevCong: Proportion of arterial DVMT occurring when congestion is severe
- ArtDvmtPropExtCong: Proportion of arterial DVMT occurring when congestion is extreme
- AveCongPrice: Average price paid (dollars per mile) in congestion fees
For more information see here
4.3.33 CalculateMpgMpkwhAdjustments
This module calculates adjustments to fuel economy and electric energy economy for plug-in vehicles) resulting from traffic congestion, speed smoothing(i.e. active traffic management which reduces speed variation), and ecodriving practices.
User Input Files
-
Speed smoothing and ecodriving for Marea (marea_speed_smooth_ecodrive.csv): This input file supplies information of deployment of speed smoothing and ecodriving by road class and vehicle type
- FwySmooth:Fractional deployment of speed smoothing traffic management on freeways, where 0 is no deployment and 1 is the full potential fuel savings
- ArtSmooth: Fractional deployment of speed smoothing traffic management on arterials, where 0 is no deployment and 1 is the full potential fuel savings
- LdvEcoDrive: Eco-driving penetration for light-duty vehicles; the fraction of vehicles from 0 to 1
- HvyTrkEcoDrive: Eco-driving penetration for heavy-duty vehicles; the fraction of vehicles from 0 to 1
Here is a snapshot of the file:

4.3.33.1 Internal Module Inputs
| Package | Module | Outputs | Description |
|---|---|---|---|
| VETravelPerformance | CalculateRoadPerformance | LdvFwyDvmt | Light-duty daily vehicle miles of travel in the urbanized portion of the Marea occurring on freeways |
| VETravelPerformance | CalculateRoadPerformance | LdvArtDvmt | Light-duty daily vehicle miles of travel in the urbanized portion of the Marea occurring on arterial roadways |
| VETravelPerformance | CalculateBaseRoadDvmt | LdvOthDvmt | Light-duty daily vehicle miles of travel in the urbanized portion of the Marea occurring on freeway or arterial roadways |
| VETravelPerformance | CalculateBaseRoadDvmt | HvyTrkFwyDvmt | Heavy truck daily vehicle miles of travel in the urbanized portion of the Marea occurring on freeways |
| VETravelPerformance | CalculateBaseRoadDvmt | HvyTrkArtDvmt | Heavy truck daily vehicle miles of travel in the urbanized portion of the Marea occurring on arterial roadways |
| VETravelPerformance | CalculateBaseRoadDvmt | HvyTrkOthDvmt | Light-duty daily vehicle miles of travel in the urbanized portion of the Marea occurring on other roadways |
| VETravelPerformance | CalculateBaseRoadDvmt | BusFwyDvmt | Bus daily vehicle miles of travel in the urbanized portion of the Marea occurring on freeways |
| VETravelPerformance | CalculateBaseRoadDvmt | BusArtDvmt | Bus daily vehicle miles of travel in the urbanized portion of the Marea occurring on arterial roadways |
| VETravelPerformance | CalculateBaseRoadDvmt | BusOthDvmt | Bus daily vehicle miles of travel in the urbanized portion of the Marea occuring on other roadways |
| VETravelPerformance | CalculateRoadPerformance | FwyNoneCongSpeed | Average freeway speed (miles per hour) when there is no congestion |
| VETravelPerformance | CalculateRoadPerformance | FwyModCongSpeed | Light-duty daily vehicle miles of travel in the urbanized portion of the Marea occurring on arterial roadways |
| VETravelPerformance | CalculateRoadPerformance | FwyHvyCongSpeed | Average freeway speed (miles per hour) when congestion is heavy |
| VETravelPerformance | CalculateRoadPerformance | FwySevCongSpeed | Average freeway speed (miles per hour) when congestion is severe |
| VETravelPerformance | CalculateRoadPerformance | FwyExtCongSpeed | Light-duty daily vehicle miles of travel in the urbanized portion of the Marea occurring on other roadways |
| VETravelPerformance | CalculateRoadPerformance | BusFwyDvmt | Bus daily vehicle miles of travel in the urbanized portion of the Marea occurring on freeways |
| VETravelPerformance | CalculateRoadPerformance | BusArtDvmt | Bus daily vehicle miles of travel in the urbanized portion of the Marea occurring on arterial roadways |
| VETravelPerformance | CalculateRoadPerformance | BusOthDvmt | Bus daily vehicle miles of travel in the urbanized portion of the Marea occuring on other roadways |
| VETravelPerformance | CalculateRoadPerformance | FwyDvmtPropNoneCong | Proportion of freeway DVMT occurring when there is no congestion |
| VETravelPerformance | CalculateRoadPerformance | FwyDvmtPropModCong | Proportion of freeway DVMT occurring when congestion is moderate |
| VETravelPerformance | CalculateRoadPerformance | FwyDvmtPropHvyCong | Proportion of freeway DVMT occurring when congestion is heavy |
| VETravelPerformance | CalculateRoadPerformance | FwyDvmtPropSevCong | Proportion of freeway DVMT occurring when congestion is severe |
| VETravelPerformance | CalculateRoadPerformance | FwyDvmtPropExtCong | Proportion of freeway DVMT occurring when congestion is extreme |
| VETravelPerformance | CalculateRoadPerformance | ArtDvmtPropNoneCong | Proportion of arterial DVMT occurring when there is no congestion |
| VETravelPerformance | CalculateRoadPerformance | ArtDvmtPropModCong | Proportion of arterial DVMT occurring when congestion is moderate |
| VETravelPerformance | CalculateRoadPerformance | ArtDvmtPropHvyCong | Proportion of arterial DVMT occurring when congestion is heavy |
| VETravelPerformance | CalculateRoadPerformance | ArtDvmtPropSevCong | Proportion of arterial DVMT occurring when congestion is severe |
| VETravelPerformance | CalculateRoadPerformance | ArtDvmtPropExtCong | Proportion of arterial DVMT occurring when congestion is extereme |
Module Outputs
- LdvSpdSmoothFactor: Proportional adjustment of light-duty internal combustion engine (ICE) vehicle MPG due to speed smoothing
- HvyTrkSpdSmoothFactor: Proportional adjustment of heavy truck internal combustion engine (ICE) vehicle MPG due to speed smoothing
- BusSpdSmoothFactor: Proportional adjustment of bus internal combustion engine (ICE) vehicle MPG due to speed smoothing
- LdvEcoDriveFactor: Proportional adjustment of light-duty internal combustion engine (ICE) vehicle MPG due to eco-driving
- HvyTrkEcoDriveFactor: Proportional adjustment of heavy truck internal combustion engine (ICE) vehicle MPG due to eco-driving
- BusEcoDriveFactor: Proportional adjustment of bus internal combustion engine (ICE) vehicle MPG due to eco-driving
- LdIceFactor: Proportional adjustment of light-duty internal combustion engine (ICE) vehicle MPG due to congestion
- LdHevFactor: Proportional adjustment of light-duty hybrid-electric vehicle (HEV) MPG due to congestion
- LdEvFactor: Proportional adjustment of light-duty battery electric vehicle (EV) MPkWh due to congestion
- LdFcvFactor: Proportional adjustment of light-duty fuel cell vehicle (FCV) MPkWh due to congestion
- HdIceFactor: Proportional adjustment of heavy-duty internal combustion engine (ICE) vehicle MPG due to congestion
4.3.34 AdjustHhVehicleMpgMpkwh
This module adjusts the fuel economy and power efficiency of household vehicles to reflect roadway congestion.
User Input Files
-
Car service vehicle powertrain proportions by vehicle type for the model region (region_carsvc_powertrain_prop.csv): This input file is OPTIONAL. It is only needed if the user wants to modify the powertrain proportion of car services.
- CarSvcAutoPropIcev: Proportion of car service automobile travel powered by internal combustion engine powertrains
- CarSvcAutoPropHev: Proportion of car service automobile travel powered by hybrid electric powertrains
- CarSvcAutoPropBev: Proportion of car service automobile travel powered by battery electric powertrains
- CarSvcLtTrkPropIcev: Proportion of car service light truck travel powered by internal combustion engine powertrains
- CarSvcLtTrkPropHev: Proportion of car service light truck travel powered by hybrid electric powertrains
- CarSvcLtTrkPropBev: Proportion of car service light truck travel powered by battery electric powertrains
Here is a snapshot of the file:

4.3.34.1 Internal Module Inputs
| Package | Module | Outputs | Description |
|---|---|---|---|
| VETravelPerformance | CalculateMpgMpkwhAdjustments | LdvEcoDrive | Eco-driving penetration for light-duty vehicles; the fraction of vehicles from 0 to 1 |
| VETravelPerformance | CalculateMpgMpkwhAdjustments | LdvSpdSmoothFactor | Proportional adjustment of light-duty internal combustion engine (ICE) vehicle MPG due to speed smoothing |
| VETravelPerformance | CalculateMpgMpkwhAdjustments | LdvEcoDriveFactor | Proportional adjustment of light-duty internal combustion engine (ICE) vehicle MPG due to eco-driving |
| VETravelPerformance | CalculateMpgMpkwhAdjustments | LdIceFactor | Proportional adjustment of light-duty internal combustion engine (ICE) vehicle MPG due to congestion |
| VETravelPerformance | CalculateMpgMpkwhAdjustments | LdHevFactor | Proportional adjustment of light-duty hybrid-electric vehicle (HEV) MPG due to congestion |
| VETravelPerformance | CalculateMpgMpkwhAdjustments | LdFcvFactor | Proportional adjustment of light-duty fuel cell vehicle (FCV) MPkWh due to congestion |
| VESimHouseholds | CreateHouseholds | HhId | Household id |
| VELandUse | AssignLocTypes | LocType | Location type (Urban, Town, Rural) of the place where the household resides |
| VEHouseholdVehicles | AssignVehicleOwnership | Vehicles | Number of automobiles and light trucks owned or leased by the household including high level car service vehicles available to driving-age persons |
| VEHouseholdVehicles | AssignVehicleType | NumLtTrk | Number of light trucks (pickup, sport-utility vehicle, and van) owned or leased by household |
| VEHouseholdVehicles | AssignVehicleType | NumAuto | Number of automobiles (i.e. 4-tire passenger vehicles that are not light trucks) owned or leased by household |
| VEHouseholdTravel | CalculateHouseholdDvmt | Dvmt | Average daily vehicle miles traveled by the household in autos or light trucks |
| VEHouseholdVehicles | AssignVehicleAge | Type | Vehicle body type: Auto = automobile, LtTrk = light trucks (i.e. pickup, SUV, Van) |
| VEPowertrainsAndFuels | AssignHhVehiclePowertrain | Powertrain | Vehicle powertrain type: ICEV = internal combustion engine vehicle, HEV = hybrid electric vehicle, PHEV = plug-in hybrid electric vehicle, BEV = battery electric vehicle, NA = not applicable because is a car service vehicle |
| VEHouseholdVehicles | CreateVehicleTable | VehicleAccess | Identifier whether vehicle is owned by household (Own), if vehicle is low level car service (LowCarSvc), or if vehicle is high level car service (HighCarSvc) |
| VEPowertrainsAndFuels | AssignHhVehiclePowertrain | MPG | Average miles of vehicle travel powered by fuel per gasoline equivalent gallon |
| VEPowertrainsAndFuels | AssignHhVehiclePowertrain | GPM | Average gasoline equivalent gallons per mile of vehicle travel powered by fuel |
| VEPowertrainsAndFuels | AssignHhVehiclePowertrain | MPKWH | Average miles of vehicle travel powered by electricity per kilowatt-hour |
| VEPowertrainsAndFuels | AssignHhVehiclePowertrain | KWHPM | Average kilowatt-hours per mile of vehicle travel powered by electricity |
| VEPowertrainsAndFuels | AssignHhVehiclePowertrain | MPGe | Average miles of vehicle travel per gasoline equivalent gallon (fuel and electric powered) |
| VEPowertrainsAndFuels | AssignHhVehiclePowertrain | ElecDvmtProp | Average miles of vehicle travel per gasoline equivalent gallon (fuel and electric powered) |
| VEPowertrainsAndFuels | AssignHhVehiclePowertrain | FuelCO2ePM | Average grams of carbon-dioxide equivalents produced per mile of travel powered by fuel |
| VEPowertrainsAndFuels | AssignHhVehiclePowertrain | ElecCO2ePM | Average grams of carbon-dioxide equivalents produced per mile of travel powered by electricity |
Module Outputs
- MPG: Average miles of vehicle travel powered by fuel per gasoline equivalent gallon
- GPM: Average gasoline equivalent gallons per mile of vehicle travel powered by fuel
- MPKWH: Average miles of vehicle travel powered by electricity per kilowatt-hour
- KWHPM: Average kilowatt-hours per mile of vehicle travel powered by electricity
- MPGe: Average miles of vehicle travel per gasoline equivalent gallon (fuel and electric powered)
- ElecDvmtProp: Average miles of vehicle travel per gasoline equivalent gallon (fuel and electric powered)
- FuelCO2ePM: Average grams of carbon-dioxide equivalents produced per mile of travel powered by fuel
- IsEcoDrive: Flag identifying whether drivers in household are eco-drivers
4.3.35 CalculateVehicleOperatingCost
This module calculates vehicle operating costs per mile of travel and uses those costs to determine the proportional split of DVMT among household vehicles. The module also calculates the average out-of-pocket costs per mile of vehicle by household, as well as the cost of social and environmental impacts, and road use taxes per mile of vehicle travel.
User Input Files
- Vehicle access time for
Azone(azone_vehicle_access_times.csv): This file supplies data for vehicle access and eagress time.
OwnedVehAccessTime:Average amount of time in minutes required for access to and egress from a household-owned vehicle for a trip
HighCarSvcAccessTime: Average amount of time in minutes required for access to and egress from a high service level car service for a trip
-
LowCarSvcAccessTime: Average amount of time in minutes required for access to and egress from a low service level car service for a trip
Here is a snapshot of the file:

Fuel and Electricity Cost (azone_fuel_power_cost.csv)
This file supplies data for retail cost of fuel and electricity by Azone. This input can be developed using local history or querying the Energy Information Administration (EIA) for historical gasoline and diesel and power prices.
- FuelCost:Retail cost of fuel per gas gallon equivalent in dollars (before taxes are added)
- PowerCost: Retail cost of electric power per kilowatt-hour in dollars (before taxes are added)
Here is a snapshot of the file:
| Geo | Year | FuelCost.2005 | PowerCost.2005 |
|---|---|---|---|
| RVMPO | 2010 | 2.43 | 0.08 |
| RVMPO | 2038 | 5.75 | 0.208 |
-
Vehicle taxes for
Azone(azone_veh_use_taxes.csv): This file supplies data for vehicle related taxes- FuelTax:Tax per gas gallon equivalent of fuel in dollars
- VmtTax: Tax per gas gallon equivalent of fuel in dollars
- PevSurchgTaxProp: Proportion of equivalent gas tax per mile paid by hydrocarbon fuel consuming vehicles to be charged to plug-in electric vehicles per mile of travel powered by electricity
Here is a snapshot of the file:

-
Proportional external costs for the ragion (region_prop_externalities_paid.csv): This file supplies data for climate change and other social costs.
- PropClimateCostPaid: Proportion of climate change costs paid by users (i.e. ratio of carbon taxes to climate change costs
- PropOtherExtCostPaid: Proportion of other social costs paid by users
Here is a snapshot of the file:

User Input Parameters
Value of time (valueoftime) : This parameter set the value of time (base cost year dollars per hour). It should be defined in model_parameters.json
{"NAME": "ValueOfTime",
"VALUE": "16",
"TYPE": "double",
"UNITS": "base cost year dollars per hour"
}
Internal Module Inputs
| Package | Module | Outputs | Description |
|---|---|---|---|
| VETravelPerformance | CalculateRoadPerformance | AveLdvSpd | Average light-duty vehicle speed (miles per hour) on all roadways weighted by the proportions of light-duty vehicle travel |
| VETravelPerformance | CalculateRoadPerformance | AveCongPrice | Average price paid (dollars per mile) in congestion fees |
| VEHouseholdVehicles | CreateVehicleTable | HighCarSvcCost | Average cost in dollars per mile for travel by high service level car service |
| VEHouseholdVehicles | CreateVehicleTable | LowCarSvcCost | Average cost in dollars per mile for travel by low service level car service |
| VESimHouseholds | CreateHouseholds | HhId | Household id |
| VEHouseholdVehicles | CreateVehicleTable | VehId | Unique vehicle ID |
| VESimHouseholds | PredictIncome | Income | Total annual income of household |
| VEHouseholdTravel | CalculateHouseholdDvmt | Dvmt | Average daily vehicle miles traveled by the household in autos or light trucks |
| VEHouseholdVehicles | CalculateVehicleOwnCost | HasPaydIns | Identifies whether household has pay-as-you-drive insurance for vehicles: 1 = Yes, 0 = no |
| VEHouseholdTravel | CalculateVehicleTrips | VehicleTrips | Average number of vehicle trips per day by household members |
| VELandUse | AssignParkingRestrictions | OtherParkingCost | Daily cost for parking at shopping locations or other locations of paid parking not including work |
| VEHouseholdVehicles | AssignVehicleAge | Type | Vehicle body type: Auto = automobile, LtTrk = light trucks (i.e. pickup, SUV, Van) |
| VEHouseholdVehicles | AssignVehicleAge | Age | Vehicle age in years |
| VEHouseholdVehicles | CreateVehicleTable | VehicleAccess | Identifier whether vehicle is owned by household (Own), if vehicle is low level car service (LowCarSvc), or if vehicle is high level car service (HighCarSvc) |
| VEPowertrainsAndFuels | AssignHhVehiclePowertrain | Powertrain | Vehicle powertrain type: ICEV = internal combustion engine vehicle, HEV = hybrid electric vehicle, PHEV = plug-in hybrid electric vehicle, BEV = battery electric vehicle, NA = not applicable because is a car service vehicle |
| VEPowertrainsAndFuels | AssignHhVehiclePowertrain | GPM | Average gasoline equivalent gallons per mile of vehicle travel powered by fuel |
| VEPowertrainsAndFuels | AssignHhVehiclePowertrain | KWHPM | Average kilowatt-hours per mile of vehicle travel powered by electricity |
| VEPowertrainsAndFuels | AssignHhVehiclePowertrain | ElecDvmtProp | Average miles of vehicle travel per gasoline equivalent gallon (fuel and electric powered) |
| VEPowertrainsAndFuels | AssignHhVehiclePowertrain | FuelCO2ePM | Average grams of carbon-dioxide equivalents produced per mile of travel powered by fuel |
| VEPowertrainsAndFuels | AssignHhVehiclePowertrain | ElecCO2ePM | Average grams of carbon-dioxide equivalents produced per mile of travel powered by electricity |
| VEHouseholdVehicles | CalculateVehicleOwnCost | InsCost | Annual vehicle insurance cost in dollars |
| VELandUse | AssignParkingRestrictions | ParkingCost | Daily cost for long-term parking (e.g. paid on monthly basis) |
| VELandUse | AssignParkingRestrictions | IsCashOut | Is worker paid parking in cash-out-buy-back program: 1 = yes, 0 = no |
| VELandUse | AssignParkingRestrictions | PaysForParking | Does worker pay for parking: 1 = yes, 0 = no |
Module Outputs
- AveVehCostPM: Average out-of-pocket cost in dollars per mile of vehicle travel
- AveSocEnvCostPM: Average cost in dollars of the social and environmental impacts per mile of vehicle travel
- AveRoadUseTaxPM: Average road use taxes in dollars collected per mile of vehicle travel
- DvmtProp: Proportion of household DVMT allocated to vehicle
- AveGPM: Average gasoline equivalent gallons per mile of household vehicle travel
- AveKWHPM: Average kilowatt-hours per mile of household vehicle travel
- AveCO2ePM: Average grams of carbon-dioxide equivalents produced per mile of household vehicle travel
4.3.36 BudgetHouseholdDvmt
This module adjusts average household DVMT to keep the quantity within household operating cost limits. The limit for each household is calculated in several steps. First, the proportion of the household’s income that may be spent on vehicle operating costs is calculated using a model that is explained below. This is called the budget proportion. Then an adjusted household income for budget calculation purposes is calculated by adding the annual cost of insurance for households subscribing to payd-as-you-drive (PAYD) insurance, cash-out parking payments for workers who work at an employer that has cash-out-buy-back parking, and any vehicle ownership cost savings for households that substitute high level car service for one or more household vehicles. The adjusted household income is muliplied by the budget proportion and divided by the average vehicle operating cost per mile for the household to determine the maximum household DVMT that fits within the household budget. The household DVMT is then set at the lesser of this budget maximum or the modeled household DVMT. The budget proportion model is estimated using data from the Bureau of Labor’s consumer expenditure survey for the years from 2003 to 2015. The data used are the nominal dollar expenditures by household income category and year by transportation category. The values for the operating cost categories (gas and oil, and maintenance and repair) are summed and then divided by the midpoint value for each income category to calculate the budget proportion for each income group and each year. From this the mean value is computed for each income group. The budget proportions for each income group and year are divided by the mean values by income group to normalize values. The standard deviation for the combined normalized values is computed and value of 3 deviations above the mean is set as the maximum normalized value. The mean values by income group are multiplied by this normalized maximum to derive a budget proportion maximum by income group. A smoothed splines model of the budget proportion as a function of income is then estimated from the calculated budget proportion maximums. This model is used to calculate the budget proportion for a household based on the household income. The minimum and maximum values of the calculated budget proportion maximums are used as constraints to avoid unreasonable results for very low incomes and very high incomes.
Internal Module Inputs
| Package | Module | Outputs | Description |
|---|---|---|---|
| VESimHouseholds | CreateHouseholds | HhId | Household id |
| VESimHouseholds | CreateHouseholds | HHSize | Number of persons in the household |
| VESimHouseholds | PredictIncome | Income | Total annual income of household |
| VELandUse | AssignLocTypes | LocType | Location type (Urban, Town, Rural) of the place where the household resides |
| VETravelPerformance | CalculateVehicleOperatingCost | AveVehCostPM | Average out-of-pocket cost in dollars per mile of vehicle travel |
| VEHouseholdVehicles | AdjustVehicleOwnership | OwnCostSavings | Annual vehicle ownership cost (depreciation, finance, insurance, taxes) savings in dollars resulting from substituting the use of car services for a household vehicle |
| VEHouseholdVehicles | CalculateVehicleOwnCost | HasPaydIns | Identifies whether household has pay-as-you-drive insurance for vehicles: 1 = Yes, 0 = no |
| VETravelPerformance | CalculateVehicleOperatingCost | AveGPM | Average gasoline equivalent gallons per mile of household vehicle travel |
| VETravelPerformance | CalculateVehicleOperatingCost | AveKWHPM | Average kilowatt-hours per mile of household vehicle travel |
| VETravelPerformance | CalculateVehicleOperatingCost | AveCO2ePM | Average grams of carbon-dioxide equivalents produced per mile of household vehicle travel |
| VELandUse | AssignParkingRestrictions | ParkingCost | Daily cost for long-term parking (e.g. paid on monthly basis) |
| VELandUse | AssignParkingRestrictions | IsCashOut | Is worker paid parking in cash-out-buy-back program: 1 = yes, 0 = no |
| VELandUse | AssignParkingRestrictions | PaysForParking | Does worker pay for parking: 1 = yes, 0 = no |
| VEHouseholdVehicles | CalculateVehicleOwnCost | InsCost | Annual vehicle insurance cost in dollars |
Module Outputs
- Dvmt: Average daily vehicle miles traveled by the household in autos or light trucks
- UrbanHhDvmt: Average daily vehicle miles traveled in autos or light trucks by households residing in the urbanized portion of the Marea
- RuralHhDvmt: Average daily vehicle miles traveled in autos or light trucks by households residing in the non-urbanized portion of the Marea
- DailyGGE: Gasoline equivalent gallons consumed per day by household vehicle travel
- DailyKWH: Kilowatt-hours consumed per day by household vehicle travel
- DailyCO2e: Grams of carbon-dioxide equivalents produced per day by household vehicle travel
- WalkTrips: Average number of walk trips per year by household members
- BikeTrips: Average number of bicycle trips per year by household members
- TransitTrips: Average number of public transit trips per year by household members
- VehicleTrips: Average number of vehicle trips per day by household members
4.3.37 CalculateComEnergyAndEmissions
This module calculates the energy consumption and carbon emissions of heavy trucks and light-duty commercial service vehicles. It does not calculate the values for car service vehicles which are calculated as part of the household emissions. It also does not calculate public transit emissions which are calculated in the CalculateTransitEnergyAndEmissions module.
User Input Files
-
Light trucks proportion for the region (region_comsvc_lttrk_prop.csv): This file supplies data for the light truck proportion og commercial vehicles
-
ComSvcLtTrkProp: Regional proportion of commercial service vehicles that are light trucks
Here is a snapshot of the file:

-
ComSvcLtTrkProp: Regional proportion of commercial service vehicles that are light trucks
Here is a snapshot of the file:
-
Commercial service vehicle powertrain proportions by vehicle type (region_comsvc_powertrain_prop.csv): This input file is OPTIONAL. It is only needed if the user wants to modify the powertrain proportion of commercial vehicles.
- ComSvcAutoPropIcev: Proportion of commercial service automobile travel powered by internal combustion engine powertrains
- ComSvcAutoPropHev: Proportion of commercial service automobile travel powered by hybrid electric powertrains
- ComSvcAutoPropBev: Proportion of commercial service automobile travel powered by battery electric powertrains
- ComSvcLtTrkPropIcev: Proportion of commercial service light truck travel powered by internal combustion engine powertrains
- ComSvcLtTrkPropHev: Proportion of commercial service light truck travel powered by hybrid electric powertrains
- ComSvcLtTrkPropBev: Proportion of commercial service light truck travel powered by battery electric powertrainss
Here is a snapshot of the file:

-
Heavy duty truck powertrain proportions (region_hvytrk_powertrain_prop.csv): This input file is OPTIONAL. It is only needed if the user wants to modify the powertrain proportion of heavy duty trucks.
- HvyTrkPropIcev: Proportion of heavy truck travel powered by internal combustion engine powertrains
- HvyTrkPropHev: Proportion of heavy truck travel powered by hybrid electric powertrains
- HvyTrkPropBev: Proportion of heavy truck travel powered by battery electric powertrains
Here is a snapshot of the file:

Internal Module Inputs
| Package | Module | Outputs | Description |
|---|---|---|---|
| VEPowertrainsAndFuels | CalculateCarbonIntensity | ElectricityCI | Carbon intensity of electricity at point of consumption (grams CO2e per megajoule) |
| VEPowertrainsAndFuels | CalculateCarbonIntensity | HhAutoFuelCI | Average carbon intensity of fuels used by household automobiles (grams CO2e per megajoule)) |
| VEPowertrainsAndFuels | CalculateCarbonIntensity | HhLtTrkFuelCI | Average carbon intensity of fuels used by household light trucks (grams CO2e per megajoule) |
| VEPowertrainsAndFuels | CalculateCarbonIntensity | HvyTrkFuelCI | Average carbon intensity of fuels used by heavy trucks (grams CO2e per megajoule) |
| VETravelPerformance | CalculateMpgMpkwhAdjustments | LdvEcoDrive | Eco-driving penetration for light-duty vehicles; the fraction of vehicles from 0 to 1 |
| VETravelPerformance | CalculateMpgMpkwhAdjustments | HvyTrkEcoDrive | Eco-driving penetration for heavy-duty vehicles; the fraction of vehicles from 0 to 1 |
| VETravelPerformance | CalculateMpgMpkwhAdjustments | LdvSpdSmoothFactor | Proportional adjustment of light-duty internal combustion engine (ICE) vehicle MPG due to speed smoothing |
| VETravelPerformance | CalculateMpgMpkwhAdjustments | LdvEcoDriveFactor | Proportional adjustment of light-duty internal combustion engine (ICE) vehicle MPG due to eco-driving |
| VETravelPerformance | CalculateMpgMpkwhAdjustments | HvyTrkSpdSmoothFactor | Proportional adjustment of heavy truck internal combustion engine (ICE) vehicle MPG due to speed smoothing |
| VETravelPerformance | CalculateMpgMpkwhAdjustments | LdIceFactor | Proportional adjustment of light-duty internal combustion engine (ICE) vehicle MPG due to congestion |
| VETravelPerformance | CalculateMpgMpkwhAdjustments | LdHevFactor | Proportional adjustment of light-duty hybrid-electric vehicle (HEV) MPG due to congestion |
| VETravelPerformance | CalculateMpgMpkwhAdjustments | HvyTrkEcoDriveFactor | Proportional adjustment of heavy truck internal combustion engine (ICE) vehicle MPG due to eco-driving |
| VETravelPerformance | CalculateMpgMpkwhAdjustments | LdEvFactor | Proportional adjustment of light-duty battery electric vehicle (EV) MPkWh due to congestion |
| VETravelPerformance | CalculateMpgMpkwhAdjustments | HdIceFactor | Proportional adjustment of heavy-duty internal combustion engine (ICE) vehicle MPG due to congestion |
| VETravelPerformance | CalculateBaseRoadDvmt | HvyTrkUrbanDvmt | Base year Region heavy truck daily vehicle miles of travel in urbanized areas |
| VETravelPerformance | CalculateBaseRoadDvmt | HvyTrkRuralDvmt | Base year Region heavy truck daily vehicle miles of travel in rural (i.e. non-urbanized) areas |
| VETravelPerformance | CalculateBaseRoadDvmt | ComSvcUrbanDvmt | Commercial service daily vehicle miles of travel associated with Marea urbanized household activity |
| VETravelPerformance | CalculateBaseRoadDvmt | ComSvcRuralDvmt | Commercial service daily vehicle miles of travel associated with Marea rural household activity |
Module Outputs
ComSvcUrbanGGE: Average daily amount of hydrocarbon fuels consumed by commercial service vehicles associated with urban household activity in gas gallon equivalents
ComSvcRuralGGE: Average daily amount of hydrocarbon fuels consumed by commercial service vehicles associated with rural household activity in gas gallon equivalents
HvyTrkUrbanGGE: Average daily amount of hydrocarbon fuels consumed by heavy trucks on urbanized area roadways in the Marea in gas gallon equivalents
ComSvcUrbanKWH: Average daily amount of electricity consumed by commercial service vehicles associated with urban household activity in kilowatt-hours
ComSvcRuralKWH: Average daily amount of electricity consumed by commercial service vehicles associated with rural household activity in kilowatt-hours
ComSvcUrbanCO2e: Average daily amount of carbon-dioxide equivalents produced by commercial service vehicles associated with urban household activity in grams
ComSvcRuralCO2e: Average daily amount of carbon-dioxide equivalents produced by commercial service vehicles associated with rural household activity in grams
HvyTrkUrbanCO2e: Average daily amount of carbon-dioxide equivalents produced by heavy trucks on urbanized area roadways in the Marea in grams
ComSvcAveUrbanAutoCO2eRate: Average amount of carbon-dioxide equivalents produced by commercial service automobiles per mile of travel on urbanized area roadways in grams per mile
ComSvcAveUrbanLtTrkCO2eRate: Average amount of carbon-dioxide equivalents produced by commercial service light trucks per mile of travel on urbanized area roadways in grams per mile
HvyTrkAveUrbanCO2eRate: Average amount of carbon-dioxide equivalents produced by heavy trucks per mile of travel on urbanized area roadways in grams per mile
HvyTrkRuralGGE: Average daily amount of hydrocarbon fuels consumed by heavy trucks on rural roadways in the Region in gas gallon equivalents
HvyTrkUrbanGGE: Average daily amount of hydrocarbon fuels consumed by heavy trucks on urbanized area roadways in the Region in gas gallon equivalents
HvyTrkRuralKWH: Average daily amount of electricity consumed by heavy trucks on rural roadways in the Region in kilowatt-hours
HvyTrkUrbanKWH: Average daily amount of electricity consumed by heavy trucks on urbanized area roadways in the Region in kilowatt-hours
HvyTrkRuralCO2e: Average daily amount of carbon-dioxide equivalents produced by heavy trucks on rural roadways in the Region in grams
HvyTrkUrbanCO2e: Average daily amount of carbon-dioxide equivalents produced by heavy trucks on urbanized area roadways in the Region in grams
4.3.38 CalculatePtranEnergyAndEmissions
This module calculates the energy consumption and carbon emissions of public transit vehicle emissions in urbanized areas.
User Input Files
-
Transit powertrain proportions by transit vehicle type and Marea (marea_transit_powertrain_prop.csv): This input file is OPTIONAL. It is only needed if the user wants to modify the mixes of transit vehicle powertrains.
- VanPropIcev: Proportion of transit van travel using internal combustion engine powertrains
- VanPropHev: Proportion of transit van travel using hybrid electric powertrains
- VanPropBev: Proportion of transit van travel using battery electric powertrains
- BusPropIcev: Proportion of transit bus travel using internal combustion engine powertrains
- BusPropHev: Proportion of transit bus travel using hybrid electric powertrains
- BusPropBev: Proportion of transit bus travel using battery electric powertrains
- RailPropIcev: Proportion of transit rail travel using internal combustion engine powertrains
- RailPropHev: Proportion of transit rail travel using hybrid electric powertrains
- RailPropEv: Proportion of transit rail travel using electric powertrains
Here is a snapshot of the file:
Internal Module Inputs
| Package | Module | Outputs | Description |
|---|---|---|---|
| VEPowertrainsAndFuels | CalculateCarbonIntensity | ElectricityCI | Carbon intensity of electricity at point of consumption (grams CO2e per megajoule) |
| VEPowertrainsAndFuels | CalculateCarbonIntensity | TransitVanFuelCI | Average carbon intensity of fuel used by transit vans (grams CO2e per megajoule) |
| VEPowertrainsAndFuels | CalculateCarbonIntensity | TransitBusFuelCI | Average carbon intensity of fuel used by transit buses (grams CO2e per megajoule) |
| VEPowertrainsAndFuels | CalculateCarbonIntensity | TransitRailFuelCI | Average carbon intensity of fuel used by transit rail vehicles (grams CO2e per megajoule) |
| VETransportSupply | AssignTransitService | VanDvmt | Total daily miles traveled by vans of various sizes to provide demand responsive, vanpool, and similar services |
| VETransportSupply | AssignTransitService | BusDvmt | Total daily miles traveled by buses of various sizes to provide bus service of various types |
| VETransportSupply | AssignTransitService | RailDvmt | Total daily miles traveled by light rail, heavy rail, commuter rail, and similar types of vehicles |
Module Outputs
- BusGGE: Average daily amount of hydrocarbon fuels consumed by bus transit vehicles in urbanized area in gas gallon equivalents
- RailGGE: Average daily amount of hydrocarbon fuels consumed by rail transit vehicles in urbanized area in gas gallon equivalents
- VanGGE: Average daily amount of hydrocarbon fuels consumed by van transit vehicles in urbanized area in gas gallon equivalents
- BusKWH: Average daily amount of electricity consumed by bus transit vehicles in urbanized area in kilowatt-hours
- RailKWH: Average daily amount of electricity consumed by rail transit vehicles in urbanized area in kilowatt-hours
- VanKWH:Average daily amount of electricity consumed by van transit vehicles in urbanized area in kilowatt-hours
- BusCO2e: Average daily amount of carbon-dioxide equivalents produced by bus transit vehicles in urbanized area in grams
- RailCO2e: Average daily amount of carbon-dioxide equivalents produced by rail transit vehicles in urbanized area in grams
- VanCO2e: Average daily amount of carbon-dioxide equivalents produced by van transit vehicles in urbanized area in grams
- BusCO2eRate: Average amount of carbon-dioxide equivalents produced by bus transit vehicles per mile of travel in urbanized area in grams per mile
- RailCO2eRate: Average amount of carbon-dioxide equivalents produced by rail transit vehicles per mile of travel in urbanized area in grams per mile
- VanCO2eRate: Average amount of carbon-dioxide equivalents produced by van transit vehicles per mile of travel in urbanized area in grams per mile
4.4 Development and Installation
This section describes the installation and use of VE-RSPM.
4.4.1 Installation of VisionEval and VE-RSPM
VE-RSPM and VisionEval framework are implemented in R, a statistical programming language and environment. Both R and VisionEval are open source and freely available. For running VE-RSPM you need to follow these steps:
- Install R (users are encouraged to also install RStudio, a free and open-source integrated development environment for R)
- Install VisionEval
- Run VE-RSPM
The VisionEval installer is available here. Follow the instructions on this page carefully to install the Visioneval on your system.
4.4.2 Running VE-RSPM Base Scenario
4.4.2.1 Preparing inputs
Once VisionEval and VE-RSPM have been installed, a directory with sample data will be available at ../models/VERSPM/. (Note .. refers to the parent directory of the unzipped installer file).
The VE-RSPM directory serves the dual purposes of providing sample data and serving as a template for local modification to other locations.
The ../models/VERSPM/ directory contains sample input files for the Rogue Valley region in Oregon. These inputs can be modified or replaced to investigate the impacts of policy changes or to model a different region. The folder contains multiple files and subfolders:

run_model.R is the core script for running the model. It consists of calls to the modules that make up the model. The user may modify the script to call the desired modules.

The defs directory contains five model definition files which is introduced in Model Definition Files

The inputs directory contains a number of CSV and JSON files that provide inputs for the modules. Each module specifies what input files it needs. If you would like to know
the description of each input file and how you can change those files for your desired testing see Inputs_and_Parameters

There is complete set of test data for RVMPO which you will find out in the VERSPM_base_model folder. You can use those data to test VERRSPM run.
the ../models/VERSPM/ directory contains sample input files for RV MPO, Oregon. These can be modified or replaced to investigate the impacts of policy changes or to model a different region.
To modify a scenario, the appropriate input files are edited. For example, to change the flat rate tax of vehicles for future azone_hh_veh_own_taxes.csv would be modified in Excel, LibreOffice, or a text editor to change the VehOwnFlatRateFee of year 2038

4.4.2.2 Running the Model
There are multiple ways to run VisionEval models. VisionEval models can be run via the command line directly or using openModel, and can be run for one scenario or multiple scenarios in parallel. Results can be viewed in tabular form or with the interactive VEScenarioViewer.
- Start R (or RStudio) and make sure your directory is set to the installer folder. The easiest way to do this is to double-click
VisionEval.Rproj, which will be associated with RStudio if that is installed correctly. - You should see ‘Welcome to VisionEval!’ on the RStudio console. Then run the following commands:
rspmmod <- openModel('VERSPM')
rspmmod$run()
By default this will run the model in ../models/VERSPM/ directory. The default model is for the Rouge Valley (Oregon) MPO, for 2010 and 2038.
After running the script you will see how the modules will be running in order.
The model run will take approximately 10-15 minutes. Once complete, the output are exported to ../models/VERSPM/outputs in 3 different zone levels.
4.4.3 Running VE-RSPM Multiple Scenarios
Strategic planning often requires the assessment of large numbers of future scenarios, each assessing a different combination of prioritizations, policy decisions, and constraints.
The VEScenarios module provides the capability to quickly set up, run, and visualize large numbers of VE-RSPM scenarios using a baseline scenario combined with multiple changes to model inputs.
After going to ../models/VERSPM_Scenarios folder, you will see multiple subfolders and scripts.

4.4.3.0.1 VERSPM_base_model
This directory contains the inputs and R script necessary to run the base scenario, as described above.
4.4.3.0.2 defs
VE-RSPM_Scenarios/defs directory contains the same files as the VERSPM_base_model/defs directory, but the model_parameters.json file differs between VERSPM_base_model/defs andVE-RSPM_Scenarios/defs differs in that the latter
version contains just four parameters specifying the locations of inputs and outputs, as well as the number of processors (NWorkers) to use. The default is 4, but be sure to set this to a number appropriate to your machine.
[
  {
    "NAME": "ModelFolder",
    "VALUE": "VERSPM_base_model",
    "TYPE": "character",
    "UNITS": "NA",
    "PROHIBIT": "NA",
    "SIZE": 20,
    "ISELEMENTOF": ""
  },
  {
    "NAME": "ScenarioInputFolder",
    "VALUE": "scenario_inputs",
    "TYPE": "character",
    "UNITS": "NA",
    "PROHIBIT": "NA",
    "SIZE": 20,
    "ISELEMENTOF": ""
  },
  {
    "NAME" : "ScenarioOutputFolder",
    "VALUE": "scenarios",
   "TYPE": "character",
   "UNITS": "NA",
   "PROHIBIT": "NA",
   "SIZE": 20,
   "ISELEMENTOF": ""
  },
  {
    "NAME" : "NWorkers",
    "VALUE": "6",
    "TYPE" : "integer",
    "UNITS" : "NA",
    "PROHIBIT" : "c('NA', '< 0')",
    "ISELEMENTOF" : ""
  }
]
4.4.3.0.3 Inputs
The inputs folder in VERRSPM_Scenarios also differs from that in VERSPM_base_model. In this case, there is only a single file specifying the output data tables that should be exported as CSV files in the outputs directory.

4.4.3.0.4 scenario_inputs
Model scenarios are defined in terms of combinations of individual model input parameters and policy choices. The various inputs are defined in the scenario_inputs folder.
Scenario inputs consist of eleven folders, one for each of a particular category of input, as described below. All eleven folders are required.
Within each folder, there are subfolders containing input files, one per specific input. Each of the folders must contain at least one subfolder named “1,” defining the input for the base scenario. Subsequent numbered folders contain input files modifying parameters of interest, as shown in the screenshots below:
Model inputs not otherwise specified in the scenario_inputs directory are drawn from files in VERSPM_base_model/defs and VERSPM_base_model/inputs

The subfolder names and scenario inputs are defined as follows (input file to modify given in parentheses):
- B - Bicycles (
azone_prop_sov_dvmt_diverted.csv) : Network improvements, incentives, and technologies that encourage bicycling and other light-weight vehicle travel- 1 - Base bicycling percentage of SOV tours less than 20 miles (9.75%)
- 2 - Increase diversion of SOV tours to 20%
- C - Vehicle Travel Cost (
azone_hh_veh_own_taxes.csv) and (region_prop_externalities_paid.csv) : Combination of fuel prices and charges to pay for roadway costs and possibly externalities- 1 - No change in fuel prices or increase in roadway or externality charges
- 2 - Keep the vehicle ownership cost the same
- 3 - Higher climate cost and pay as you drive insurance
- D - DemandManagement (
bzone_travel_demand_mgt.csv) : Programs to encourage less private vehicle travel- 1 - Baseline implementation of ITS
- 2 - Increase the effectiveness of implementation of ITS
- E - Driving Efficiency (
marea_operations_deployment.csv) and (marea_speed_smooth_ecodrive.csv) and (other_ops_effectiveness.csv) : Driving efficiency by increasing implementation of ITS- 1 - Base
- 2 - Increased the proportion by 10%
- F - Technology Mix and CI (
marea_transit_powertrain_prop.csv) and (region_carsvc_powertrain_prop.csv) and (region_comsvc_powertrain_prop.csv`) : Vehicle technology mix and carbon intensity of fuels.- 1 - Baseline vehicle technology mix
- 2 - Increased percentage of electric vehicles in household and commercial setting by 20%
- G - Fuel Price (
azone_fuel_power_cost.csv) : Real fuel price in 2010 USD- 1 - Baseline fuel price
- 2 - Double fuel price
- 3 - Quadruple fuel price
- I - Income (
azone_fuel_power_cost.csv) : Real average household income in 2010 USD- 1 - Baseline household income
- 2 - Income growth of 7% w.r.t reference
- 3 - Income growth of 14% w.r.t reference
- L - LandUse (
azone_hhsize_targets.csv) and (bzone_urban_du_proportions.csv) : Distribution of population and employment by place type- 1 - Base, Maintain current distribution
- 2 - LU overlaps with HHsize + Population
- P - Parking (
bzone_parking.csv) : The extent of paid parking and its price- 1 - Current extent and daily fee
- 2 - Increase parking cost by 100% and proportion charted by 10%.
- T - Transit (
marea_transit_service.csv) : The extent and frequency of transit service- 1 - Current public transit service level
- 2 - Double public transit service level
- 3 - Quadruple public transit service level
- V - Vehicle Characteristics (
azone_hh_veh_mean_age.csv) and (azone_lttrk_prop): The combination of fuel prices and vehicle travel charges to pay for roadways and to pay for externalities such as carbon pricing- 1 - Base
- 2 - Light truck proportion at 35% of the fleet and the average vehicle age at 8 years
Running all of these input values will result in 10368 total scenarios, which would take days to run. User usually does not need all the possible combinations of scenarios.
VE-RSPM Scenarios are grouped in 5 different categories which you can modify in category_config.json :
- Community Design : Policies that seek to enable shorter trips and alternate modes such as promotion of mixed use land use, transit service, bicycling, and parking management. ( group of L, B, P , T )
- Marketing/Incentive : Policies that improve driving efficiency such as ecodriving,and Intelligent Transportation System efforts, as well as programs that reduce auto demand such as carsharing, and home or work-based transportation demand management.( group of D, E )
- Pricing : Policies that move towards true cost pricing such as road user fees to pay for the cost of operating, maintaining and improving roads, pay-as-you-drive (PAYD) insurance, and environmental impact fees such as a carbon tax. ( C )
- Vehicles/Fuels : Factors representing changes to future vehicles and fuels ( group of V, F )
- Income : Context factor on the assumed growth of statewide average per capita income ( I )
Depending on how many scenarios exist in each of these five groups, total number of scenarios will be determined.
To test the multi-scenario capability in less time, reduce the number of scenario inputs by deleting some of the numbered folders, making sure to retain the “1” folder for each of the six options.
Note that if you change the directory structure in scenario_inputs, you will have to change category_config.json and scenario_config.json to match the new directory structure.
To modify the scenario inputs, the numbered subdirectories can be created or deleted. Each directory contains a single input file containing the modified model parameter.
4.4.3.0.5 Running the model for multiple scenarios
Similar to base case the model can be run in the command line. To run the model using R, run the following commands:
scenario_rspm <- openModel('VERSPM_Scenarios')
scenario_rspm$run()
After starting the run,model automatically builds scenarios by creating all possible combinations of settings found in scenario_inputs. The scenarios to run are found in the newly created scenarios directory.

Each directory is essentially a copy of VERSPM_base_model, with inputs modified as specified in the scenario_inputs directory. Each scenario directory contains the results of a model run with its own inputs, datastore, and log file.
When finished, the VE-RSPM Scenario Viewer will automatically open to display the results. To find out more on exported metrics see Performance Metrics
In detail, the model specified by the run_model.R script. In this case, the script runs four modules that create the scenarios from the inputs, runs each and combines the results.

Return to Tutorial. ## Performance Metrics
A large number of performance metrics are produced during the run of the RPAT model, including environment and energy impacts, financial and economic impacts, and community impacts.
The full list of outputs available is as follows. Based on the geo level, you will find our these metrics in of the three files ( Azone.csv , Bzone.csv , Marea.csv ) in the outputs folder
- VanDvmt: Total daily miles traveled by vans of various sizes to provide demand responsive, vanpool, and similar services.
- BusDvmt: Total daily miles traveled by buses of various sizes to provide bus service of various types.
- RailDvmt: Total daily miles traveled by light rail, heavy rail, commuter rail, and similar types of vehicles.
- UrbanHhDvmt: Average daily vehicle miles traveled in autos or light trucks by households residing in the urbanized portion of the Marea
- RuralHhDvmt: Average daily vehicle miles traveled in autos or light trucks by households residing in the non-urbanized portion of the Marea
- TownHhDvmt: Average daily vehicle miles traveled in autos or light trucks by households residing in town (urban but not urbanized) portion of the Marea
- ComSvcUrbanDvmt: Commercial service daily vehicle miles of travel associated with Marea urbanized household activity
- ComSvcRuralDvmt: Commercial service daily vehicle miles of travel associated with Marea rural household activity
- HvyTrkUrbanDvmt: Base year Region heavy truck daily vehicle miles of travel in urbanized areas
- LdvOthDvmt: Light-duty daily vehicle miles of travel in the urbanized portion of the Marea occurring on other roadways
- LdvFwyArtDvmt: Light-duty daily vehicle miles of travel in the urbanized portion of the Marea occurring on freeway or arterial roadways
- HvyTrkFwyDvmt: Heavy truck daily vehicle miles of travel in the urbanized portion of the Marea occurring on freeways
- HvyTrkArtDvmt:Heavy truck daily vehicle miles of travel in the urbanized portion of the Marea occurring on arterial roadways
- HvyTrkOthDvmt: Heavy truck daily vehicle miles of travel in the urbanized portion of the Marea occurring on other roadways
- BusFwyDvmt: Bus daily vehicle miles of travel in the urbanized portion of the Marea occurring on freeways
- BusArtDvmt: Bus daily vehicle miles of travel in the urbanized portion of the Marea occurring on arterial roadways
- BusOthDvmt: Bus daily vehicle miles of travel in the urbanized portion of the Marea occuring on other roadways
- LdvFwyDvmt: Light-duty daily vehicle miles of travel in the urbanized portion of the Marea occurring on freeways
- LdvArtDvmt: Light-duty daily vehicle miles of travel in the urbanized portion of the Marea occurring on arterial roadways
- FwyNoneCongSpeed: Average freeway speed (miles per hour) when there is no congestion
- FwyModCongSpeed: Average freeway speed (miles per hour) when congestion is moderate
- FwyHvyCongSpeed: Average freeway speed (miles per hour) when congestion is heavy
- FwySevCongSpeed: Average freeway speed (miles per hour) when congestion is severe
- FwyExtCongSpeed: Average freeway speed (miles per hour) when congestion is extreme
- ArtNoneCongSpeed: Average arterial speed (miles per hour) when there is no congestion
- ArtModCongSpeed: Average arterial speed (miles per hour) when congestion is moderate
- ArtHvyCongSpeed: Average arterial speed (miles per hour) when congestion is heavy
- ArtSevCongSpeed: Average arterial speed (miles per hour) when congestion is severe
- ArtExtCongSpeed: Average arterial speed (miles per hour) when congestion is extreme
- OthSpd: Average speed (miles per hour) on other roadways
- AveLdvSpd: Average light-duty vehicle speed (miles per hour) on all roadways weighted by the proportions of light-duty vehicle travel
- FwyNoneCongDelay: Average freeway delay (hours per mile) occurring when there is no congestion
- FwyModCongDelay: Average freeway delay (hours per mile) occurring when congestion is moderate
- FwyHvyCongDelay: Average freeway delay (hours per mile) occurring when congestion is heavy
- FwySevCongDelay: Average freeway delay (hours per mile) occurring when congestion is severe
- FwyExtCongDelay: Average freeway delay (hours per mile) occurring when congestion is extreme
- ArtNoneCongDelay: Average arterial delay (hours per mile) occurring when there is no congestion
- ArtModCongDelay: Average arterial delay (hours per mile) occurring when congestion is moderate
- ArtHvyCongDelay: Average arterial delay (hours per mile) occurring when congestion is heavy
- ArtSevCongDelay: Average arterial delay (hours per mile) occurring when congestion is severe
- ArtExtCongDelay: Average arterial delay (hours per mile) occurring when congestion is extreme
- FwyDvmtPropNoneCong: Proportion of freeway DVMT occurring when there is no congestion
- FwyDvmtPropModCong: Proportion of freeway DVMT occurring when congestion is moderate
- FwyDvmtPropHvyCong: Proportion of freeway DVMT occurring when congestion is heavy
- FwyDvmtPropSevCong: Proportion of freeway DVMT occurring when congestion is severe
- FwyDvmtPropExtCong: Proportion of freeway DVMT occurring when congestion is extreme
- ArtDvmtPropNoneCong: Proportion of arterial DVMT occurring when there is no congestion
- ArtDvmtPropModCong: Proportion of arterial DVMT occurring when congestion is moderate
- ArtDvmtPropHvyCong: Proportion of arterial DVMT occurring when congestion is heavy
- ArtDvmtPropSevCong: Proportion of arterial DVMT occurring when congestion is severe
- ArtDvmtPropExtCong: Proportion of arterial DVMT occurring when congestion is extreme
- AveCongPrice: Average price paid (dollars per mile) in congestion fees
- LdvSpdSmoothFactor: Proportional adjustment of light-duty internal combustion engine (ICE) vehicle MPG due to speed smoothing
- HvyTrkSpdSmoothFactor: Proportional adjustment of heavy truck internal combustion engine (ICE) vehicle MPG due to speed smoothing
- BusSpdSmoothFactor: Proportional adjustment of bus internal combustion engine (ICE) vehicle MPG due to speed smoothing
- LdvEcoDriveFactor: Proportional adjustment of light-duty internal combustion engine (ICE) vehicle MPG due to eco-driving
- HvyTrkEcoDriveFactor: Proportional adjustment of heavy truck internal combustion engine (ICE) vehicle MPG due to eco-driving
- BusEcoDriveFactor: Proportional adjustment of bus internal combustion engine (ICE) vehicle MPG due to eco-driving
- LdIceFactor: Proportional adjustment of light-duty internal combustion engine (ICE) vehicle MPG due to congestion
- LdHevFactor: Proportional adjustment of light-duty hybrid-electric vehicle (HEV) MPG due to congestion
- LdEvFactor: Proportional adjustment of light-duty battery electric vehicle (EV) MPkWh due to congestion
- LdFcvFactor: Proportional adjustment of light-duty fuel cell vehicle (FCV) MPkWh due to congestion
- HdIceFactor: Proportional adjustment of heavy-duty internal combustion engine (ICE) vehicle MPG due to congestion
- ComSvcUrbanGGE: Average daily amount of hydrocarbon fuels consumed by commercial service vehicles associated with urban household activity in gas gallon equivalents
- ComSvcRuralGGE: Average daily amount of hydrocarbon fuels consumed by commercial service vehicles associated with rural household activity in gas gallon equivalents
- HvyTrkUrbanGGE: Average daily amount of hydrocarbon fuels consumed by heavy trucks on urbanized area roadways in the Marea in gas gallon equivalents
- ComSvcUrbanKWH: Average daily amount of electricity consumed by commercial service vehicles associated with urban household activity in kilowatt-hours
- ComSvcRuralKWH: Average daily amount of electricity consumed by commercial service vehicles associated with rural household activity in kilowatt-hours
- ComSvcUrbanCO2e: Average daily amount of carbon-dioxide equivalents produced by commercial service vehicles associated with urban household activity in grams
- ComSvcRuralCO2e: Average daily amount of carbon-dioxide equivalents produced by commercial service vehicles associated with rural household activity in grams
- HvyTrkUrbanCO2e: Average daily amount of carbon-dioxide equivalents produced by heavy trucks on urbanized area roadways in the Marea in grams
- ComSvcAveUrbanAutoCO2eRate: Average amount of carbon-dioxide equivalents produced by commercial service automobiles per mile of travel on urbanized area roadways in grams per mile
- ComSvcAveUrbanLtTrkCO2eRate: Average amount of carbon-dioxide equivalents produced by commercial service light trucks per mile of travel on urbanized area roadways in grams per mile
- HvyTrkAveUrbanCO2eRate: Average amount of carbon-dioxide equivalents produced by heavy trucks per mile of travel on urbanized area roadways in grams per mile
- HvyTrkRuralGGE: Average daily amount of hydrocarbon fuels consumed by heavy trucks on rural roadways in the Region in gas gallon equivalents
- HvyTrkUrbanGGE: Average daily amount of hydrocarbon fuels consumed by heavy trucks on urbanized area roadways in the Region in gas gallon equivalents
- HvyTrkRuralKWH: Average daily amount of electricity consumed by heavy trucks on rural roadways in the Region in kilowatt-hours
- HvyTrkUrbanKWH: Average daily amount of electricity consumed by heavy trucks on urbanized area roadways in the Region in kilowatt-hours
- HvyTrkRuralCO2e: Average daily amount of carbon-dioxide equivalents produced by heavy trucks on rural roadways in the Region in grams
- HvyTrkUrbanCO2e: Average daily amount of carbon-dioxide equivalents produced by heavy trucks on urbanized area roadways in the Region in grams
- BusGGE: Average daily amount of hydrocarbon fuels consumed by bus transit vehicles in urbanized area in gas gallon equivalents
- RailGGE: Average daily amount of hydrocarbon fuels consumed by rail transit vehicles in urbanized area in gas gallon equivalents
- VanGGE: Average daily amount of hydrocarbon fuels consumed by van transit vehicles in urbanized area in gas gallon equivalents
- BusKWH: Average daily amount of electricity consumed by bus transit vehicles in urbanized area in kilowatt-hours
- RailKWH: Average daily amount of electricity consumed by rail transit vehicles in urbanized area in kilowatt-hours
- VanKWH:Average daily amount of electricity consumed by van transit vehicles in urbanized area in kilowatt-hours
- BusCO2e: Average daily amount of carbon-dioxide equivalents produced by bus transit vehicles in urbanized area in grams
- RailCO2e: Average daily amount of carbon-dioxide equivalents produced by rail transit vehicles in urbanized area in grams
- VanCO2e: Average daily amount of carbon-dioxide equivalents produced by van transit vehicles in urbanized area in grams
- BusCO2eRate: Average amount of carbon-dioxide equivalents produced by bus transit vehicles per mile of travel in urbanized area in grams per mile
- RailCO2eRate: Average amount of carbon-dioxide equivalents produced by rail transit vehicles per mile of travel in urbanized area in grams per mile
- VanCO2eRate: Average amount of carbon-dioxide equivalents produced by van transit vehicles per mile of travel in urbanized area in grams per mile
- AveVehCostPM: Average out-of-pocket cost in dollars per mile of vehicle travel
- AveSocEnvCostPM: Average cost in dollars of the social and environmental impacts per mile of vehicle travel
- AveRoadUseTaxPM: Average road use taxes in dollars collected per mile of vehicle travel
- WalkTrips: Average number of walk trips per year by household members
- BikeTrips: Average number of bicycle trips per year by household members
- TransitTrips: Average number of public transit trips per year by household members
- VehicleTrips: Average number of vehicle trips per day by household members
For simplicity, eight key metrics are calculated from multiple scenario runs and are shown on the Scenario Viewer output page:
GHG Target Reduction: percentage reduction in light-duty vehicle CHG emissions
DVMT Per Capita: daily vehicle miles of travel of residents divided by population
Walk Trips Per Capita: annual residents walk trips ( not including recreation or walk to transit)
Air Pollution Emissions: daily metric tons of pollutants emitted from all light-duty vehicle travel
Annual Fuel Use: annual million gallons of gasoline and other fuels consumed by all light-duty vehicle travel
Truck Delay: daily vehicle-hours of delay for heavy truck trael on area roads
Household Vehicle Cost as Percentage of Income: average percentage of income spent by all households by owning and operating light-duty vehicles
-
Low Income Household Vehicle Cost as Percentage of Income: average percentage of income spent by low-income households on owning and operating light-duty vehicles

Using this viewer, users can select inputs of land use or policies and view their effects on model outputs, and the process can also be reversed, allowing users to choose desired outcomes and view the policy scenarios that reflect those outcomes. Instructions for using the viewer are built in to the page itself. To access a condensed version of the instructions, click on the Quick Start button at the top of the page.
To understand more detail on the available categories of inputs and their levels as well as more detailed descriptions of the model output shown in the bar charts you can click on Detailed Instructions button

To see which policy choices and land use inputs result in desired outcomes, select a range of values within one outcome. In this case, the low end of the DVMT per capita has been chosen:

As the outcome is selected, the bar graphs and the data table at the bottom (not shown) update to show only the scenarios resulting in the selected outcome. For instance, In this case, the low end of DVMT per capita are associated with the most increase in fuel price or more public transit and parking costs for community design.
It is also possible to select inputs to view the associated outcomes. To do so, simply click on the bar corresponding to the desired scenario input. In this case (below) the scenario with highest fuel price is selected to view the impacts on outcome variables Here, DVMT per capita and annual fuel cost digrams shift to the left as expected since less people are expected to drive in this scenario
